Website Uptime Monitoring: Definition, Benefits, Types, Metrics, Tools, and Alerts

Uptime monitoring is basically the habit of constantly checking “is my system actually up and usable right now?” across your websites, servers, APIs, and critical apps, and getting real-time alerts the moment something goes wrong so you can fix issues before users start screaming or revenue disappears. It sounds simple, but in practice it’s a mix of uptime monitoring tools, metrics, synthetic checks, logs, and alerting rules that all work together to protect your business from downtime.

What is Uptime Monitoring?
Uptime monitoring is the continuous method of testing that your websites, servers, APIs, databases, DNS and other systems are available to be accessed by real users and are performing as expected. Inaction uptime monitoring tools will make automated requests, such as HTTP checks, ping monitor, port check and API call from various locations to verify that your system works properly.
It’s like a 24/7 health check on your online presence that doesn’t get tired, doesn’t forget and is not dependent on a user first complaining. Website Monitoring is watching your site or web app, but server uptime monitoring watches the underlying infrastructure (think: web servers, mail servers, database servers) that power everything. Good uptime monitoring services give you more than just an “is up” or “is down.” They tell you what application availability percentages are, how fast responses are and where failures originate.
What is Uptime Monitoring Good For?
Uptime monitoring is good for staying ahead of problems, protecting revenue, and proving reliability to customers without constantly staring at dashboards. It turns random downtime incidents into structured, trackable events with clear downtime incident alerts and recovery data.
Real-time Incident Detection
The real-time monitoring with rapid targeted alerts is the greatest feature. Uptime monitors ping your site every few seconds or minutes and will send you real-time alerts when it detects errors, downtime, error status codes and misconfigured SSL certificates. So instead of finding out about an outage on Twitter, you get alerted straight away via email, SMS, Slack, Teams or webhooks as soon as your website (or whatever) goes down!
Monitor detects downtime triggers downtime incident alerts is the core semantic triple of incident detection here. That feedback loop lets your on-call engineer jump in fast, reduce mean time to recovery, and limit the blast radius for users.
Benchmarking Performance
It’s not just about if things are “up” or “down”, it's also about how well they have been running overall over time. If you measure average response time, error rate and the percentage of availability on your application, you can benchmark when it used to be normal so that in case of degradation before full-outage, you'll have known it. Web performance monitoring tests DNS lookup time, TCP connection time, TLS negotiation speed, server processing power, and content download to show you where the slowness develops.
Over weeks or months, you see patterns: maybe response time spikes every Monday, or a specific region suffers slow DNS resolution. Historical metrics reveal trends and bottlenecks better capacity planning and optimization is the long-term payoff.
Early Warning for Potential Issues
Good monitoring provides early warnings well before a hard crash. Perhaps your SSL certificate is expiring shortly, disk usage is growing, DNS settings are wrong in a region or error rates start to increase after each deployment. Synthetic monitoring checks and real user performance metrics combined offer vague signs that something is peculiar while the site technically emerges, though perhaps crippled.
Early anomaly gets detected by uptime monitoring issues that can be fixed proactively is what turns teams from reactive firefighters into proactive maintainers. This is where uptime monitoring overlaps nicely with availability monitoring and reliability engineering.
Saving Money
Downtime is expensive. For e‑commerce, SaaS, and subscription products, every minute your checkout, login or key API is down is money out the door with a customer experience that’s difficult to restore. The downtime is less (shorter duration) and less often due to early warning of failure and reduced MTTR.
Even for small companies, finding an issue in five minutes as opposed to two hours can be the difference between a minor hiccup and a deluge of angry support tickets. Better uptime monitoring reduces downtime and impacts direct cost savings and happier users.
Providing Peace of Mind
Honestly, no website stays perfect forever. Things break. Hosts reboot servers, certificates expire, developers ship bugs. Uptime monitoring services give you peace of mind that if something goes wrong at 3 a.m., you’ll hear about it and not wake up to chaos.
That psychological safety is underrated. Clear alerts and status pages provide visibility and reassurance, less stress for the team and better trust for customers.
How Does Uptime Monitoring Work?
Uptime monitoring operates on an architectural level Under the hood, uptime monitoring is about scheduling automated tests to act as if they were visits that potential customers would make and reporting the results. These tests consist of ping monitoring, HTTP and HTTPS checks, TCP port tests, DNS lookups, SSL certificate checks as well as more advanced synthetic flows that mimic the experience real users have.
That is, when a check fails, your system will typically verify that failure from another location to avoid false positives before sending downtime alerts via your preferred methods. They also take every uptime check result and store that data so you can figure out the uptime percentage, average time to recovery and see how they have trended over time.” The agent sends test requests to your services and create uptime metrics and instant alerting.
What are the Benefits of Uptime Monitoring?
Benefits add up quickly if you already have good coverage across apps, infrastructure and network.
- Less downtime: When you’re able to detect incidents faster and take action more quickly, total minutes of outage gets slashed.
- Better user experience: Less 500 errors, less service time-outs, better rendering performance in different geographical areas.
- More robust SLAs and confidence: You can monitor the application % uptime, and speak with confidence when asked about up times by customers.
- Data to decide upon: Actual metrics on response time, error rates, and request volume help you sell upgrades or architecture changes.
- Compliance and auditing: In regulated industries, monitoring lends itself to meeting availability and security needs (e.g., SSL certificate validity, continuous logging).
Business continuity uptime monitoring helps to maintain compliance and a more resilient business overall.
What are the Types of Uptime Monitoring?
There isn’t just one kind of uptime monitoring. Different layers of your stack need different checks so you don’t get blind spots. At a high level, you’ll see:
- Synthetic monitoring (active checks simulating users)
- Website uptime monitoring (HTTP and HTTPS)
- Server uptime monitoring (ping, ports, system-level availability)
- API uptime monitoring (endpoints, payloads, workflows)
- Mail server monitoring (SMTP, POP3, IMAP availability)
- Application uptime monitoring (business logic and UX paths)
- Database uptime monitoring (connectivity, queries, performance)
- DNS uptime monitoring (record resolution from multiple regions)
- Multi-location uptime monitoring (checks from different geographies)
Each of these tools and approaches to uptime monitoring address a separate failure mode, and combined they tell the entire story behind system uptime. As already mentioned, layered monitoring ensures visibility into infrastructure, network, and application can be achieved with fewer surprises.
Synthetic Monitoring
Synthetic monitoring is when the monitoring system does script-based activities like a pretend user: load pages, click flows, hit APIs, log in, or check out. It’s not like passively looking at logs or metrics, as it generates its own traffic and is up 24/7 when users are asleep.
For uptime monitoring, synthetic checks confirm that a real user can perform this action successfully from this location right now?” synthetic monitoring executes scripted interactions validates uptime and performance from the outside-in.
Website Uptime Monitoring
Website uptime monitoring is the classic form: tools send HTTP or HTTPS requests to your URLs, follow redirects, and verify that they receive the right status codes, content, and response times. In many setups, website uptime monitoring is combined with SSL certificate monitoring and DNS checks to catch certificate expiry or name resolution failures as well. Website uptime monitoring checks site availability and speeds fewer invisible outages where the site “works for you” but fails for users in other regions.
Why Website Uptime Monitoring Is Important
Website uptime monitoring is very important for businesses who depend on online presence. It catches outages immediately, meaning lost revenue from downtime. Studies have shown that a second of interruption can mean thousands in lost income per hour. Dependable access is what earns your customers trust. Here are tips to keep your site ranking in search engines and make sure you are compliant so you can love on a living.
Avoiding Revenue Loss
If your homepage loads but your checkout fails, you’re still losing money. Website uptime monitoring helps detect partial outages like broken payment flows, failed redirects, or slow pages that push users away. For online shops and SaaS, this is pure revenue protection. Continuous website performance monitoring prevents long unnoticed failures, higher conversion and less abandoned sessions.
Ensuring Website Accessibility
Just one standing definition of accessibility is can people around the world access and use a site here., not just in your office. Multiple location uptime monitoring tries to hit your website from several locations around the world to avoid local ISP failures, CDN troubles and regional DNS issues. Multi-site checks ensure that the site is globally accessible and provides a more consistent user experience no matter where the user is located.
Maintaining Search Rankings
Search engines doesn’t appreciate sites that are down constantly or very slow. Frequent downtimes or really bad performance can undermine crawl frequency and perceived quality, both of which might impact rankings eventually. Site uptime monitoring— minimizes the likelihood of crawlers repeatedly bumping into errors or timeouts. Healthy search crawling and more consistent SEO results supported by stable uptime and performance.
Identifying and Fixing Issues Quickly
With uptime monitoring tools, errors aren’t vague. You see timestamps, status codes, failing locations, and often screenshots or page content for HTTP failures. That context speeds debugging and helps you roll back or patch quickly. Good incident data shortens investigation time and lower mean time to recovery.
Monitoring Website Performance
Beyond simple uptime, website performance monitoring breaks down the timing chain: DNS, TCP, TLS, server processing, and content download. If DNS lookup is slow, you know it’s not your app. If content download is slow, maybe the page is too heavy or the CDN is misconfigured. Granular performance metrics pinpoint bottlenecks in the request lifecycle more targeted optimization.
Meeting Compliance Standards
Some industries and contracts require you to meet certain uptime targets or maintain proper SSL and security configurations. Website uptime monitoring and SSL certificate monitoring together create a record that shows you’re taking availability and encryption seriously. Continuous monitoring logs support audits and SLA evidence, easier compliance checks and fewer disputes.
Port Monitoring
Port Monitoring checks whether specific TCP ports (like 80, 443, 25, 3306) are accepting connections. It’s often used to verify web servers, mail servers, and database servers at a lower level than HTTP. TCP port checks verify network-level availability early detection of firewall, routing, or service binding issues.
Server Uptime Monitoring
Server up-time monitoring is when you measure uptime at the host level - is a server responsive to ping, can you log onto it with SSH/Remote Desktop and are required services listening on their port. A lot of monitoring suites do a hybrid of all the above like ping monitor, port checker, resource metrics such as cpu, ram and disk usage. Server uptime monitoring watches your hosts’ health, and less surprises when infrastructure dies silently under your apps.
Ping
Ping monitoring sends ICMP echo requests and measures how long it takes to get a reply. If the server fails to respond, you likely have network or host availability issues.
Connect
Ping monitor tests network connectivity quick signal when a server or network path is down or heavily congested. Ping alone doesn’t guarantee the application is healthy, but it’s a very fast, cheap signal.
SSL Certificate Monitoring
SSL certificate monitoring tracks the validity and expiry date of your TLS certificates and alerts you before they expire or if there are configuration problems. It’s one of those things people promise they’ll “remember to renew” and then inevitably forget under pressure. SSL certificate monitoring prevents unexpected HTTPS failures, fewer “connection is not secure” browser warnings and lost trust.
API Uptime Monitoring
Up time monitoring API will monitor your APIs to make sure they are reachable, fast and the responses are correct, not just with status code 200. It often involves multi-step flows, JSON schema validation, and authentication to simulate real application behaviour.API monitoring validates that your API is available and responds with what you expect, more reliable integrations and fewer silent failures hidden behind 200 OK.
Mail Server Monitoring
Mail server monitoring focuses on SMTP, POP3, and IMAP servers to make sure email systems stay available and responsive. Checks might include connecting to ports 25, 465, 587, 993, or 995 and verifying simple handshake commands. Mail server monitoring protects email delivery infrastructure with fewer missed notifications and bounced messages during incidents.
Application Uptime Monitoring
Application uptime monitoring takes into account more than just hardware and ports, but examines business-level functions: can users authenticate to the app, can a user search, add an item to cart or complete a workflow with zero errors. It frequently will employ artificial journeys and in-app error tracking. With application uptime monitoring, monitoring checks better reflect end-user experience incidents which correspond to what a real user experiences rather than just server level categorial.
What are the Metrics of Application Uptime Monitoring?
Application monitoring lives and dies on good metrics that reflect real behavior.
Average Response Time
Average response time quantifies the length of time spent responding to requests for your app over a period. High averages or spikes indicate performance problems or overburdened infrastructure. Average Response Time reflects user perceived speed obvious indicators for optimization.
Mean Time to Recovery
Mean time to recovery (MTTR) is the average time it takes from identifying an incident until normal service has been restored. With good uptime monitoring services and on-call processes in place, you should reduce this number over time. MTTR is a measure of how quickly incidents are resolved and a key KPI for reliability teams.
Uptime Rate
The proportion of time your service is available in contrast to the total time in a given period is the uptime rate or uptime percentage. Common targets are 99.9 percent (three nines) or more, based on business requirements. What they both understood, however, was the concept of service reliability as measured by uptime percentage — a straightforward figure that pertains not only to management but also to customers.

Request Volume
Request volume measures how many calls or page views your application handles per time unit. It helps you see whether issues correlate with load and whether you’re close to capacity limits. Request volume tracking reveals traffic patterns more accurately scaling and capacity planning.
Application Availability Percentage
Application availability percentage is a refined uptime rate focused on the application layer: how often users could successfully perform key operations. It considers partial outages like login failing while the homepage still loads. Application availability percentage reflects true usable uptime and a more realistic view of user experience than simple host uptime.
Error Rate
Error rate tracks the proportion of failing requests, such as 5xx errors or app-specific error codes. Even if the app stays technically “up,” a rising error rate is an early warning. Error rate acts as a leading indicator of trouble chances to fix issues before users flood support.
Database Uptime Monitoring
Database uptime monitoring checks connectivity, query execution, latency, and resource usage for databases. It’s not enough that the DB process is running; your app must be able to connect and execute real queries in time. Database uptime monitoring validates practical database availability resulting in fewer outages caused by slow or locked databases.
Microsoft SQL
Microsoft SQL Server monitoring usually includes checking TCP connectivity, running test queries, and watching metrics like query duration and connection pool usage.
MySQL
MySQL uptime monitoring follows similar ideas: verify connections on port 3306, run lightweight queries, and watch performance metrics. SQL monitoring ensures databases respond correctly to stable backends for apps depending on them.
HTTP and HTTPS Monitoring
HTTP and HTTPS monitoring sends actual web requests and verifies whether status codes, headers, response time or page content matched or didn’t match. They are the power behind website uptime monitoring, supporting both non-encrypted and SSL traffic. HTTP/HTTPS checks emulate browser requests to ensure accurate detection of web and API outages.
DNS Uptime Monitoring
DNS uptime monitoring verifies that your domains resolve correctly from multiple resolvers and locations. If DNS fails, your site might be “up” but completely invisible. DNS monitoring guards name resolution layer fewer mysterious outages where hosts look fine but users can’t reach them.
Multi-Location Uptime Monitoring
Uptime multi-location monitoring does checks from multiple global points, is able to observe regional issues and lowers false positives. If some location failing but others pass, perhaps a regional network or ISP issue. Multi-location monitoring separates worldwide base stations outages from regional ones for more intelligent incident response and less false alarms.
How to Check Site Uptime?
To check site uptime quickly, many people use an online uptime checker tool or one of the free tiers of popular uptime monitoring tools. For a quick manual approach, you can:
- Use curl or a browser to see HTTP status and load time.
- Use ping or traceroute to check connectivity.
- Use DNS lookup tools to confirm records.
Dedicated uptime monitoring services provide automated site uptime checks; you don’t rely on manual testing or user complaints.
Best Uptime Monitoring Services for Small Businesses
Small businesses usually need affordable, simple uptime monitoring services that still offer real-time alerts and basic website performance monitoring. Popular options include UptimeRobot, Better Stack, Uptrends, and several others that offer generous free plans or low-priced tiers.
Here’s a quick feel for how a table comparison might look:
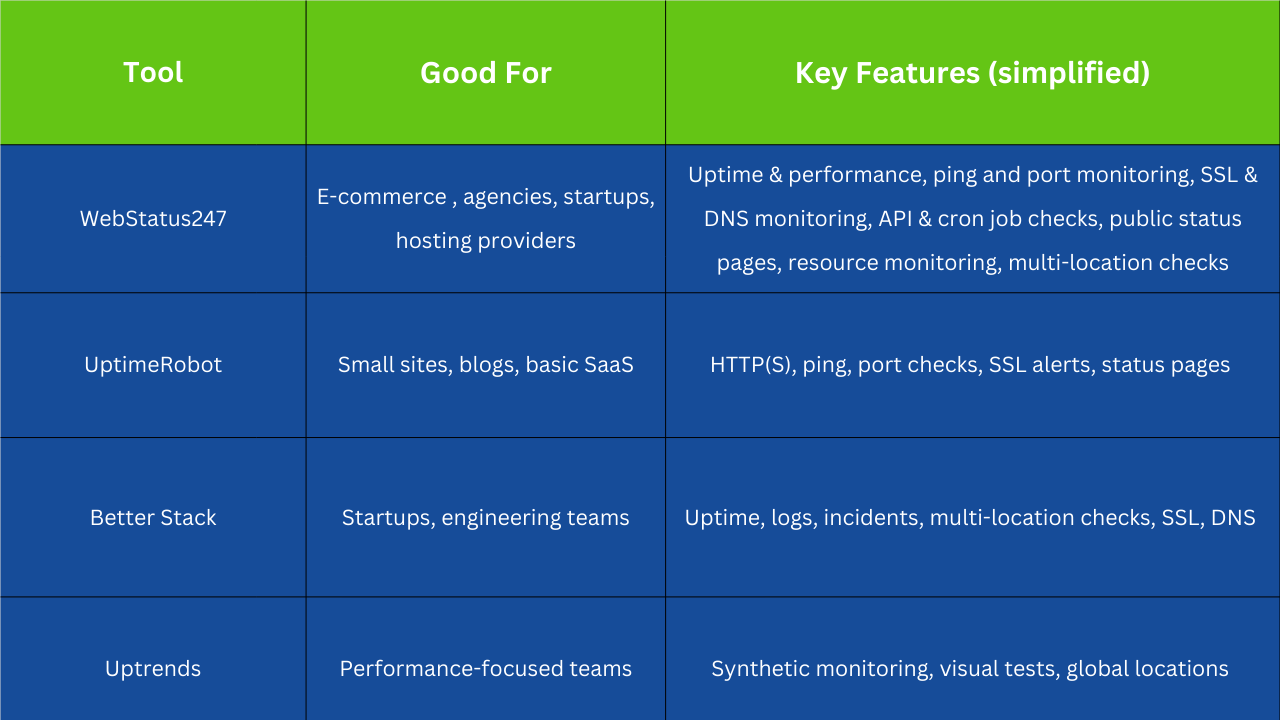
Small businesses choose simple uptime monitoring tools and solid protection without heavy DevOps investment.
Webstatus247 offers a free plan, where it allows monitoring up to 60 websites at five minutes intervals and also it offers monitoring with uptime, performance and notification checking.
Top Uptime Monitoring Tools with Real-time Alerts
You need tools that work with your communication stack and offer very detailed alert rules for real-time alerts. When a monitor fails or some performance crosses a threshold, many of these tools will alert over email and SMS, but also extend to Slack, Microsoft Teams, Telegram and webhooks.
The Best Uptime Monitoring Services of 2021 Most top uptime monitoring tools offer real-time alerting and integrations so that you can route an downtime incident alert to the correct on-call person or team, not spamming everyone.
How to Determine System Uptime?
System uptime is a measure of how long a system has been running since the time it was last rebooted and how frequently the system has been available in a given time period. On many operating systems (Linux, BSD, Windows etc), you can use this to query the system uptime itself or use monitoring logs and calculate uptimes percentages. System uptime, it also provides a single-view of stability and reset frequency in addition to the OS-level data.
Unix-like Systems (Linux, FreeBSD)
On Unix-like systems, you usually have built-in tools to inspect system uptime.
Using uptime
The uptime command shows how long the system has been running, how many users are logged in, and load averages. The uptime command reports duration since last boot quick snapshot of system stability.
Using System-specific Interfaces
Linux
On Linux, uptime information comes from /proc/uptime under the hood, and many tools read it. You can also use monitoring agents that collect this value and send it to your uptime dashboards.
BSD
BSD systems have similar commands and system calls to query uptime, usually exposed via uptime or sysctl. Unix-like OS tools provide system uptime simple local checks without extra software.
Microsoft Windows
Windows exposes system uptime through Task Manager, systeminfo, WMI, and other utilities.
Windows Task Manager
In the Task Manager’s Performance tab, you can see “Up time” for the system. Task Manager shows time since last reboot, an easy way for admins to check system uptime without commands.
Systeminfo
Running systeminfo in Command Prompt displays system boot time, from which you can infer uptime.
NET command
Commands like net statistics workstation or net statistics server show statistics including time since last reset for those services.
Windows Management Instrumentation (WMI)
WMI queries allow scripts and monitoring tools to pull system uptime programmatically, which is useful for large fleets.
Uptime.exe
Older resource kits and some third-party tools provide uptime.exe for direct uptime display.
FreeDOS
Even lightweight or legacy environments like FreeDOS can expose basic uptime information through simple utilities or add-ons, although it’s less standardized.
OpenVMS
OpenVMS has its own commands to display system uptime and stability, which many enterprises still rely on for critical systems. OS-specific commands and APIs make it possible to read system uptime, locally monitoring agents can combine this with external checks for full visibility.
What are the Uptime Metrics?
When people talk about uptime metrics, they usually mean: uptime percentage, downtime minutes, mean time between failures, mean time to recovery, error rate, request volume, and application availability percentage. These metrics turn vague reliability talk into numbers you can track. Uptime metrics translate service reliability clear targets, like 99.95 percent uptime with MTTR under 30 minutes.
Can an Uptime Detector Alert You When a Website Goes Down?
Yes, an uptime detector can absolutely alert you when a website goes down, and that’s the whole point of uptime monitoring. The monitor runs checks at regular intervals, and when they fail, it sends downtime alerts to your configured channels. Uptime detector compares check results against thresholds and triggers real-time alerts on failures.
Does Uptime Tracking Measure Uptime Percentage?
Most uptime tracking systems automatically calculate uptime percentage over selected periods (last 24 hours, 7 days, 30 days, etc.). They count how many checks passed vs failed or how long the service stayed unavailable and compute the percentage. Uptime tracking produces uptime percentage reports that are easy to share SLAs and status pages with customers.
Can a Domain Uptime Check Detect Server Outages?
A domain uptime check that includes DNS, HTTP, and ping monitoring can detect many kinds of server outages, yes. If DNS fails, HTTP checks won’t even reach your server; if the server is down, ping and HTTP checks will fail; if just the app is broken, HTTP will return errors even while ping succeeds. Domain uptime checks link DNS, network, and HTTP layers better detection of server outages and related issues than any single check alone.
What is Availability Monitoring?
Availability monitoring tracks how often your website, server, or application is reachable and actually working for users, across time. It doesn’t stop at “server is on”, it includes performance issues, partial failures, and broken features that make the service unusable in practice. It usually combines uptime monitoring tools, website performance monitoring, error tracking, and sometimes synthetic monitoring checks that simulate real users. The goal is simple but very practical: keep your service available, not just your hardware powered on.
What is the Difference between Uptime vs Availability?
Uptime is a time measurements describing how long the system has been running and not crashing. Availability is a qualitative usability measurement that shows you how frequently users are able to get into and use the system in the way it was designed.
It's totally possible to have a very high server uptime, and terrible service availability if the system is under so much load it was unusably slow or it just consistently throwing errors at your website visitors. So uptime monitoring sees the on/off status, and availability monitoring examines the quality of the user experience.
Does an uptime guarantee promise a specific level of website availability?
Not really, at least not in a strict, user-experience sense. An uptime guarantee in a hosting SLA usually promises that the server or service will be online a certain percentage of time, like 99.9% uptime, within a period. But that does not always include slow responses, partial outages, or situations where the site is technically up but unusable for many users. So an uptime guarantee is better than nothing, but it is not a guarantee that your real-world website availability percentage will feel perfect to your visitors.
How to Calculate Uptime Percentage?
The basic formula for uptime percentage is a simple one: Uptime % = (Total time – Downtime)/ total time x 100. In words, you have the whole monitoring period minus your downtime turned into a percentage.
For instance, if you monitor a site for 30 days and it goes down for 60 minutes in one week, you stick those numbers into the formula to calculate the uptime percentage. A lot of uptime monitoring tools and uptime checker tools will work this out for you, depending on the incidents they detect.
What does 99.9% Uptime mean?
99.9% uptime sometimes referred to as three nines, means your service can be down for around 8.7 hours in a full year. Insanely reliable that is at the moment although if the downtime comes at a bad time it can still mean lost revenue or reputation. There are even greater levels such as 99.99% and 99.999% uptime whose annual downtime decreases to under one hour and even a few minutes respectively but that would require much more cost to attain in practice. So what is good enough might be 99.9 percent uptime monitoring and that’s it's for a lot of small businesses while mission-critical applications may aim for four or five nines.
How does an uptime checker tool work?
An uptime checker pings your website or service from one or multiple locations with a recurring synthetic request for example, an HTTP check, or ping monitoring. If we encounter any errors, timeouts or repeated failures, the tool marks a downtime incident and typically triggers high-priority real-time notifications. These services will keep a record of each check they perform, keep history and calculate your uptime %, average response time and sometimes app availability % for reporting. This has since expanded to include SSL certificate monitoring, DNS checks and port checks for many modern uptime monitoring tools.
What do you mean by incident management?
When you hear someone mention incident management typically they are referring to taking care of unplanned activities that lessen a service's quality like outages or downtime or poor performance or catastrophic website failures. That includes detection, triage, communication, fixing the problem and then learning from it so that it doesn’t happen in the same way again. In a monitoring scenario incident management ties uptime monitoring alerts to downtime incidents alerts and to on-call teams for handling, transforming raw outages into tidy incidents with owners and timelines. Good incident management helps keep chaos under control when something breaks, and helps teams get better faster.
What is a downtime incident?
A down time is when your website, API, server or application is not available or doesn’t work in an unusable manner. It usually begins when the uptime monitoring tools report a continuous log of failures upchecks and validate that this isn’t some glitch from your end. It could be hosting problems, database outages, network issues or show-stopper errors on the site that preclude access for all or most users. The downtime event begins when the system goes down and ends when the monitoring checks say it's still back up.
How to receive downtime incident alerts?
To receive downtime alerts, you set up your uptime monitoring tools or website uptime monitoring solutions with notification channels such as email, SMS, Slack, Teams or webhook integrations. When the system sees that your site is down, or throwing a bunch of errors, it’ll send alerts in real time so just one dang person can jump in at once. You can generally configure rules for alerts: how many times a check must fail before an alert is triggered, who should be alerted and whether to escalate if no one acknowledges the incident. When done right, alerts about downtime incidents get to the right people quickly — and don’t waste users by spamming them with noise and false positives.
What information do downtime alerts include?
A solid downtime alert normally provides insight into what went down, when it started, the nature of any detected error and reports from locations and probes that saw failure. Many uptime monitoring options also provide the last known status code, response time and links to logs or dashboards so you can investigate right away. On more sophisticated configurations, the alert could contain impact estimates, details of other checks failing at the same time and links to suggested runbooks or steps to begin troubleshooting. All of that context helps the on call person go from alert to action without spending a ton of time researching basic facts.
When does a website cause a failure or crash?
A website causes a failure or crash when it cannot handle traffic, runs into software bugs, or loses access to critical services like the database or external APIs. Sometimes the server is still technically “up,” but the application throws errors or hangs so badly that uptime monitoring tools start reporting failures. These crashes can come from bad deployments, resource exhaustion, configuration mistakes, or security incidents that block normal behavior. In most setups, synthetic monitoring checks and website performance monitoring catch these failures quickly and feed them into incident management workflows.
What are website errors?
Website errors are the visible symptoms users see when something is wrong, such as HTTP 5xx server errors, 4xx client errors, or even endless loading with timeouts. They represent cases where the server cannot fulfill a valid request correctly, so the perceived availability drops, even if raw server uptime looks fine. From a monitoring point of view, error rates are key signals in application uptime monitoring and application availability percentage, because they directly reflect broken user journeys. High website errors over time usually trigger alerts and can support SLA reports about reliability and service quality.
Where does uptime monitoring fit in the synthetic monitoring setup?
Uptime monitoring is usually the foundation layer of a synthetic monitoring setup, acting as the early-warning system. Synthetic monitoring then builds on top of that with scripted user journeys, transaction checks, and multi-step tests that simulate real workflows like login, checkout, or search. So uptime monitoring tells you if it is up at all while broader synthetic monitoring tells you “can a fake user actually complete critical tasks without errors or slowdowns.” Together, they create a more complete view of website uptime monitoring and website performance monitoring for your stack.
How to perform WordPress uptime monitoring?
To monitor WordPress uptime, you point your uptime monitoring tools at your main site URL, and sometimes at key pages like login, checkout, or specific landing pages. The uptime checker tool sends regular HTTP requests, checks response codes, measures response time, and alerts you if the site returns errors or fails to respond. Many WordPress site owners combine external uptime monitoring services with security plugins, caching tools, and sometimes application-specific monitoring to cover both uptime and performance. That mix keeps an eye on server uptime, website errors, and even SSL certificate monitoring so the site stays stable and trustworthy over time.