Website Monitoring: Availability, Performance, Security, Infrastructure, and Complete Online Health

Websites slow down and sometimes they fail and nobody knows until a customer complains. It's the price of doing business with any online presence today.
The reason website monitoring was invented is because things break. Servers crash at 3 AM. SSL certificates expire on a Sunday weekend. Just one poorly setup plugin can take an entire checkout system down. Any serious online presence invests in monitoring because waiting for problems to surface on their own is not a strategy.
This guide is a step by step for website monitoring. From simple uptime monitoring to sophisticated infrastructure tracking and from security surveillance to real user experience analysis. Whether you run a website for a small business or enterprise web applications, understanding what monitoring does allows you to keep your digital presence healthy and your users happy.

What is Website and Web Monitoring?
Website Monitoring is the practice of testing a website or server for functionality. That entails monitoring whether the site is live, how quickly it loads, if all of its features work correctly, and that there are no security vulnerabilities.
Suppose It’s a health checkup for your website, but instead of visiting a doctor once a year, the checkup happens every few minutes, around the clock.
There are several reasons that companies use website monitoring. The obvious one is to find out when something breaks before your customers do. But monitoring goes even further. It helps teams understand performance trends, uncover slow pages, catch security vulnerabilities and enforce the kind of consistent experience that all users look for.
To do this, monitoring tools send regular requests to the websites. They test whether the site is up. They quantify how long that response lasts. They confirm that certain functionalities are as they should be Solved when something is out-of-the box, help responsible people know it.
The goal is simple. Keep the website alive, keep it speedy, keep it secure. Any more sense makes on the top of that base.
How Does Website Monitoring Work?
Website Monitoring occurs through continuous, scheduled checks. Here is the basic workflow.
A request is made to your web site by a monitoring tool, from one or more locations. This may be a simple ping to see if the server is up, or it could be a more sophisticated request that grabs an entire page and checks every individual element.
The tool records the response. Did the site respond? How long did it take? Were there any errors? Did specific content load correctly?
The tool decides, based on predefined thresholds, if there is something wrong. If the response time is over your defined acceptable value, or if it gives back an error code, the system marks it as a problem.
It sends alerts through channels you set up. Email, SMS, Slack, PagerDuty, webhooks. Whatever way attracts the attention the quickest.
The most monitoring occurs outside. That means the tool scans your site just as a real user would view it, from outside of your infrastructure. And some companies also do internal monitoring to see what goes on behind the firewall.
The frequency of checks varies. Certain sites must be monitored every minute. Others might look once every five or 10 minutes. That's why critical sites during peak time may even be monitored on a continuous basis.
All of this data is stored and analyzed. Over time, patterns emerge. You can see when your site tends to underperform, which pages have the worst problems and how you shape against historical baseline.
User monitoring goes a step further. Rather than synthetic checks, it follows real visitors as they navigate your site. This is a real-world performance which you can see across various devices, browsers and network conditions.
What Types of Website Monitoring Exist?
Website monitoring isn’t just one thing. It’s broken up into various sub-sections, with each of them dedicated to a different part of your site health. Having these categories gives businesses a framework to develop their monitoring strategy, and ensure that they’re not missing anything.
Availability & Reliability
Before anything else, a website must be accessible. Availability monitoring ensures your site is actually reachable when someone tries to visit it.
Availability Monitoring
Availability monitoring solves a fundamental problem. Is your website available now for users?
This is kind of monitoring that pings your site on a regular interval and it makes sure its up. If the site does not respond or responds with some error, the monitoring system triggers an alert.
Checks made by availability monitoring are usually available from several distant locations. A location may be reachable from New York, but not in London because different routing. Multi-location tracking catches these local failures.
Availability goals are determined for organizations based on their requirements. Some aim for 99.9% uptime. Others push for 99.99%. The difference may seem trivial, but 99.9% translates into almost 8.7 hours of downtime per year that is permissible. 99.99% gives you only around 52 minutes. Every digit matters.
Uptime Monitoring
Availability monitoring is similar to uptime monitoring. It measures how frequently your website is available and working.
Uptime monitoring applications are constantly verifying with checks, and then calculates your actual uptime overtime. They even generate reports that display the daily, weekly, monthly and yearly uptime percentages. Such numbers are important, for internal performance monitoring and to meet service level agreements with clients.
When uptime decreases, businesses have to know why. Was it a server issue? A network problem? A DNS failure? Uptime monitoring tools often provide context about what caused the downtime, making troubleshooting faster.
Uptime statistics are posted by many businesses on status pages. This type of transparency is key to build trust with customers who need assurance that the service they depend on is stable.
Cron Job Monitoring
Cron jobs are automatic tasks that are run on a predetermined schedule. Scripts for backing up, syncing data, generating reports, cleaning up and so on. Such behind-the-scenes processes are what help websites run smoothly.
With cron jobs, they just fail silently. A backup script that stopped running three weeks ago will not send you an alert on its own. You only discover the failure when you actually need that backup.
For the cron job monitoring, that would be solved by expecting regular check-ins. You set up the monitor to watch for a signal from your cron job specific intervals. If that signal does not arrive, something went wrong and you’re alerted.
This kind of monitoring would catch process failures that you’d have no easy way to see otherwise. If your organization has several scheduled tasks to computer all around the world, cron job monitoring means you can catch them before they become major issues.
Performance & UX
A website that loads but takes time to respond is almost as bad as one that does not load at all. Performance monitoring Keep your site fast.
Performance Monitoring
Can performance monitoring tell how fast your website responds to requests and loads for visitors? It evaluates metrics such as page load, response time, time to first byte and throughput.
Slow performance impacts everything. Users leave slow sites. Search engines penalise slow websites. Conversion rates drop when pages take too long to load.
Performance monitoring tools identify bottlenecks. Perhaps a certain page is being slow because the images on it are unoptimized. Perhaps the database is overloaded. Perhaps some external script is preventing the page from being rendered. Performance data should guide you toward the culprit.
This Monitoring frequently involves historical trends. You may be able to see how performance has changed over time. Did that most recent deployment make things speed up or slow down? Was your infrastructure unable to keep up with traffic growth? Trends tell the story.
Application Performance Monitoring
APM stands for application performance monitoring and goes much deeper than standard website performance. It observes the behavior of the applications at code level.
APM tools are applications to your application (meta as facebook) that record detailed performance signals. They illustrate which functions take the longest to run, where errors are being thrown, how database queries are performing and how services interact with each other.
APM is a must have for companies who are managing complex applications with dozens of microservices. Slowness in one service can become a cascading event across the entire system. APM sequences requests as they trace through services to determine where, exactly, problems start.
These also help developers tune code. APM data leads to performance problems by revealing exactly where time is being spent processing requests.
Frontend Monitoring
Frontend monitoring is concerning itself with events occurring in the user’s browser. There’s still work to do once the server sends a response. It has to parse HTML, load CSS, execute JavaScript, render images, and assemble the final page.
All of this takes time, and that time can be all over the map depending on the device you’re using and your network. Front-end monitoring collects these client side metrics.
This covers everything from DOM load time or JS execution time to how long it took something to be visible. It also monitors for errors that happen in the browser, such as JavaScript exceptions that could break a feature.
Frontend and backend monitoring typically come together. A fast server can send and receive files in the blink of an eye, but if the frontend is bloated with heavy scripts, users still experience a slow site.
Core Web Vitals
Simply, Core Web Vitals refer to a set of exact measures that Google uses to calculate page experience. They quantify the loading performance, interactivity and visual stability.
Largest Contentful Paint quantifies the time it takes for the largest content element to render on screen. This reflects perceived loading speed.
First Input Delay quantifies the wait time between a user’s initial input and when the browser is able to process it. This reflects interactivity.
CLS, commonly referred to as Cumulative Layout Shift, quantifies how often users experience unexpected layout shifts during page load. This reflects visual stability. There’s nothing more annoying to users than clicking something and then the page moves and a UI Control is clicked instead.
Why you should monitor Core Web Vitals: Google relies on them as ranking signals. Low scores could impact your search visibility. Good scores mean better standings, and happy end-users.
User Experience Monitoring
UX monitoring concerns itself with the broader picture of user-web interactions. It combines performance metrics with behavioral data to consider the real experience that people are having.
Not just a check against whether a page is loaded. It asks whether users were able to achieve what they come to do. Did the checkout go through? Did the form submission work? Did users encounter errors that blocked their goals?
User experience tracking usually includes session records and heatmaps. These tools reveal precisely how users are moving through a site; where they’re clicking, running into trouble or lagging.
The idea is to get a sense of what experience feels like for the user and not just technically.
Why you should monitor Core Web Vitals: Google relies on them as ranking signals. Low scores could impact your search visibility. Good scores mean better standings, and happy end-users.
End User Monitoring
End user monitoring specifically tracks performance and behavior from the perspective of actual visitors. It captures data from real users on real devices in real network conditions.
Unlike synthetic monitoring, which uses controlled test environments, end user monitoring reflects the diversity of actual traffic. Users on slow mobile networks experience your site differently than users on fiber connections. End user monitoring shows you both.
This data helps organizations understand where real problems exist. A site might perform well in testing but struggle for users in certain regions or on certain devices.
Real User Monitoring
Real user monitoring, often called RUM, is the specific technique of collecting performance data from actual visitors. Lightweight scripts embedded in web pages capture timing data and send it back for analysis.
RUM shows real world performance across all the variations of user environments. It captures page load times, resource timing, errors, and user interactions.
The data from RUM helps prioritize optimization efforts. If most of your users access the site from mobile devices on cellular networks, optimizing for that scenario matters more than optimizing for desktop users on fast connections.
RUM also helps identify issues that only affect certain user segments. A JavaScript error that only occurs in one browser version might affect a meaningful portion of your traffic.
Security & Trust
Security Monitoring Prevent your website from being attacked, vulnerable or having a misconfigured setting that may disclose your data or damage your reputation.
Security Monitoring
Security monitoring detects potential threats and weaknesses that the killer hurt your site. This includes malware scanning, unauthorized file change detection, suspicious traffic pattern monitoring and looking for known vulnerabilities.
Cyberattacks are constant. Robots are continuously probing websites for vulnerabilities. Monitoring the security helps organizations to identify and follow up of these threats before causing any harm.
This kind of monitoring is commonly combined with web application firewalls. It can identify DDoS attacks, SQL injection attempts, cross site scripting and other prevalent attack types.
Security monitoring also monitors internally for issues. “Any unauthorized changes to files may be a compromise. Anomalies in outbound connections may indicate the presence of malware. Surveillance flags catches that are interesting enough to justify manual inspection.
SSL Monitoring
An SSL certificate locks down the connection between user and website. They also prove that the users are talking to the correct server. Browsers now show some scary warnings unless you have a valid SSL certificate.
SSL monitoring monitors your certificates and their expiration dates. Certificates expire. When that happens, visitors are unable to reach the site securely. SSL monitoring notifies the admin before it expires and it can be renewed in time.
This is also responsible for a certificate configuration verification. It just happens that misconfigured certs, wrong encryption type or chain issues can get in the way, even if a cert is “technically” valid.
Companies with numerous domains will require SSL monitoring to monitor all its certificates in one single place. Not having an expiry on a subordinate domain can still be user unfriendly and brand damaging.
Infrastructure & Network
Behind every website sits infrastructure. Servers, networks, databases and everything else that goes into making it work. There is monitoring of that infrastructure to make sure it's working correctly.
Network Monitoring
Network monitoring is a process of monitoring the health and performance of network elements and devices. Routers, switches, firewalls, load balancers. Any hardware that shuffles data between users and servers.
Poor network connectivity leads to website issues which are hard to trace without monitoring. Lost packets, ping spikes, Packet loss and high latency - I'm getting rather frustrated as a customer. Network monitoring surfaces these problems.
This is typically the kind of monitoring that utilizes things like SNMP to pull data from network devices. It monitors bandwidth usage, rates of errors and device availability.
Monitoring is important for companies definitely with more complex network than average, so they need to keep an eye on the network to make sure it's not a problem and eventually the website won't be affected.
Server Monitoring
Server monitoring monitors the health and performance of your web server. CPU, memory, disk and process in use application status. All the measures of server health.
A high CPU server could even respond to requests but slowly. A server with a full disk could simply die. One is server monitoring that will catch such problems before they become the causes of outages.
Such monitoring frequently entails log analysis. Server logs Store Server logs are an important source of errors, security events and performance concerns. There are monitoring tools that read logs and alert on certain patterns.
For websites running on multiple servers, monitoring each one individually and understanding how they’re working together becomes crucial.
Infrastructure Monitoring
Monitoring infrastructure is a special case beyond server/network monitoring. It examines the full architectural stack and the dynamics between certain components.
Modern web infrastructure is complex. Virtual machines, containers, databases, caches, queues, load balancers. Infrastructure Monitoring follows all these parts and their interactions.
When something goes wrong, infrastructure monitoring is there to help understand the root cause. A slow website may stem from an overwhelmed database server, which in turn was caused by a cache server failure, triggered by network problems. Analyzing these dependencies requires end-to-end visibility into the infrastructure.
For websites running on multiple servers, monitoring each one individually and understanding how they’re working together becomes crucial.
Resource Monitoring
Monitoring resources focuses on the use of resource consumption. CPU, memory, storage, bandwidth. For applications, the basic things that they use.
Any statistics that you collect over time will exhibit patterns. You will observe when resources are strained, you can forecast when you should scale up and recognize processes that demand more than they should.
You use resource monitoring to plan capacity. With insights into present usage and growth patterns, companies can effectively size infrastructure without over-spending or under-sizing.
DNS Monitoring
DNS translates domain names into IP addresses. When DNS fails, users cannot reach your website even if the site itself is perfectly healthy.
DNS monitoring verifies that DNS resolution is fast and reliable. It checks that your domain resolves to the right IP and that resolution happens within acceptable time limits, and that DNS servers are responsive.
DNS problems are especially tricky because they can appear invisible from within your network. So, you may find that your internal users can resolve work but external users cannot connect at all.
This check frequently tests from several locations to detect regional DNS outages, and propagation of new nameservers.
Domain Monitoring
Domain monitoring tracks the status on domain names. Domains expire. If a domain expires, and the website disappears entirely.
This Monitoring notifies the organizations in advance as to when their domains are going to expire or be renewed. It also monitors unauthorised domain transfers and changes of WHOIS data that could indicate someone trying to steal a domain.
For those with several domains to manage, having them all easy collect in a single place helps avoid accidental forgetfulness.
Synthetic & Transaction
Synthetic and transaction monitoring simulate user behavior to verify that website features work correctly.
Synthetic Monitoring
Synthetic monitoring uses scripts to simulate user interactions with a website. Instead of waiting for real users to encounter problems, synthetic monitoring proactively tests functionality at regular intervals.
These scripts can perform complex actions. Log in, search for a product, add it to cart, proceed to checkout. By running these scripts continuously, organizations can detect broken functionality before it affects real users.
Synthetic monitoring provides consistent baselines because tests run under controlled conditions. Performance variations indicate actual changes in website behavior, not just differences in user environments.
This type of monitoring works well alongside real user monitoring. Synthetic tests catch problems quickly and consistently. Real user monitoring shows how those problems affect actual visitors.
Synthetic monitoring uses scripts to simulate user behavior on a website. Instead of waiting for real users to encounter problems, synthetic monitoring proactively tests functionality at regular intervals.
Such scripts may do complicated things. Sign in, browse a product, add to cart and continue to check out. By running these scripts on an ongoing basis, businesses can pick up broken functionality before users see it.
Synthetic monitoring creates stable baselines, because tests occur in a consistent environment. Performance differences signal the real website behavior change, not that the environment experiencing by user is different.
This type of monitoring also goes great with real user monitoring. Artificial tests are quick to catch and consistent. Real user monitoring indicates the impact of those problems on real visitors.
Transaction Monitoring
Transaction monitoring specifically tracks critical business transactions on a website. Purchases, signups, form submissions, authentication. The actions that matter most to business outcomes.
This monitoring verifies that transactions complete successfully end to end. It measures how long transactions take and catches failures at any step in the process.
For e-commerce sites, transaction monitoring on the checkout process is critical. A broken checkout means lost revenue. Every minute of checkout downtime costs money.
Transaction monitoring often goes beyond simply checking if something works. It validates that data flows correctly through the system. An order might appear to complete from the user's perspective but fail to reach the fulfillment system. Transaction monitoring catches these invisible failures.
How Can Web Pages Be Monitored for Changes?
Websites change and some changes are intentional but others are not. Monitoring for changes helps organizations track what happens on their sites.
Change detection monitoring compares current page content to previous versions. When differences appear, alerts notify administrators. This catches multiple issues. Unauthorised modifications can be a sign of security issues. If there is content on your site that nobody added, you’re in trouble. Hackers often inject malicious content, hidden links, or cryptocurrency miners into compromised sites.
Accidental changes happen too. A developer might push to production by mistake. A CMS update might alter content unexpectedly. Change monitoring catches these mistakes quickly.
For compliance purposes, some organizations must document exactly what appears on their websites at specific times. Change monitoring creates an audit trail.
This monitoring can track the entire page or specific elements. You might only care about changes to pricing information or legal text. Focused monitoring reduces noise from unimportant changes.
Some tools compare visual renders of pages rather than just HTML. This catches changes in how a page appears even if the underlying code looks the same.

How Is Overall Website Health Monitored?
Individual monitoring types each tell part of the story. Overall website health monitoring combines them into a complete picture.
Healthy websites share certain characteristics. They are available consistently. They perform quickly. They function correctly. They are secure. They run on stable infrastructure. Monitoring overall health means watching all of these dimensions together.
most organizations to use the dashboards they have which gather monitoring data from a variety of sources. These dashboards show the current status of all components at a glance. Green means healthy. Red means problems exist.
Health monitoring often includes composite scores that combine multiple metrics into a single indicator. This helps leadership understand overall status without diving into technical details.
Trend analysis matters for health monitoring. A site might be healthy right now but showing warning signs. Gradually increasing response times, slowly filling disk space, growing error rates. These trends indicate future problems.
Effective health monitoring establishes baselines for normal behavior. What does health look like for this particular website? Once baselines exist, deviations become meaningful signals.
Organizations often create status pages that display health information publicly. This transparency helps users understand current conditions and builds trust through openness about issues.
What Tools and Software Are Available for Website Monitoring?
Dozens of website monitoring tools exist, ranging from simple uptime checkers to comprehensive observability platforms. Here are some widely used options.
Webstatus247
Webstatus247 provides an affordable website monitoring. Its lifetime deal at 499 makes the tool appealing for any business that wants to avoid and frustrate to pay ongoing monthly fees.
Webstatus247 offers a free plan, where it allows monitoring up to 60 websites at five minutes intervals and also it offers monitoring with uptime, performance and notification checking.
Paid plans offer features such as one-minute check intervals, extra monitor types and advanced alerting. Webstatus247 provides Website Monitoring, Ping, Port, SSL, API, Keywords Monitoring etc.
For small businesses or big organizations with relatively simple monitoring requirements, this is good value.
Uptimerobot
One of the biggest names in monitoring is Uptimerobot, which has become so popular for its generous free tier. Free package only permits to monitor 50 websites in 5 min time intervals.
With monitor types and advanced alerting, they are other nice features for paid plans. Uptimerobot with HTTP, keyword ping and port monitoring. Uptimerobot is so easy to get running. For simple monitoring of uptime without any complexity this does the job well.
Site247
Site247 offers monitoring not just for websites, but also for servers, applications, and network infrastructure. Their offering spans real user monitoring, synthetic data and log management.
Site247 would be a fit for any organization looking to have a single place where they can use monitoring. Unification of monitoring types aids in correlating problems and has the potential to connect issues back to the root cause.
Datadog
Datadog is an enterprise-grade monitoring and observability platform. It covers infrastructure monitoring, APM, log management, real user monitoring, synthetic monitoring, and security monitoring.
The platform is powerful but complex. Datadog works well for organizations with significant infrastructure and teams dedicated to observability. Pricing scales with usage, which can become expensive at large volumes.
Datadog's strength is its ability to connect data across monitoring types. Traces link to metrics link to logs. This correlation makes troubleshooting more efficient.
Pingdom
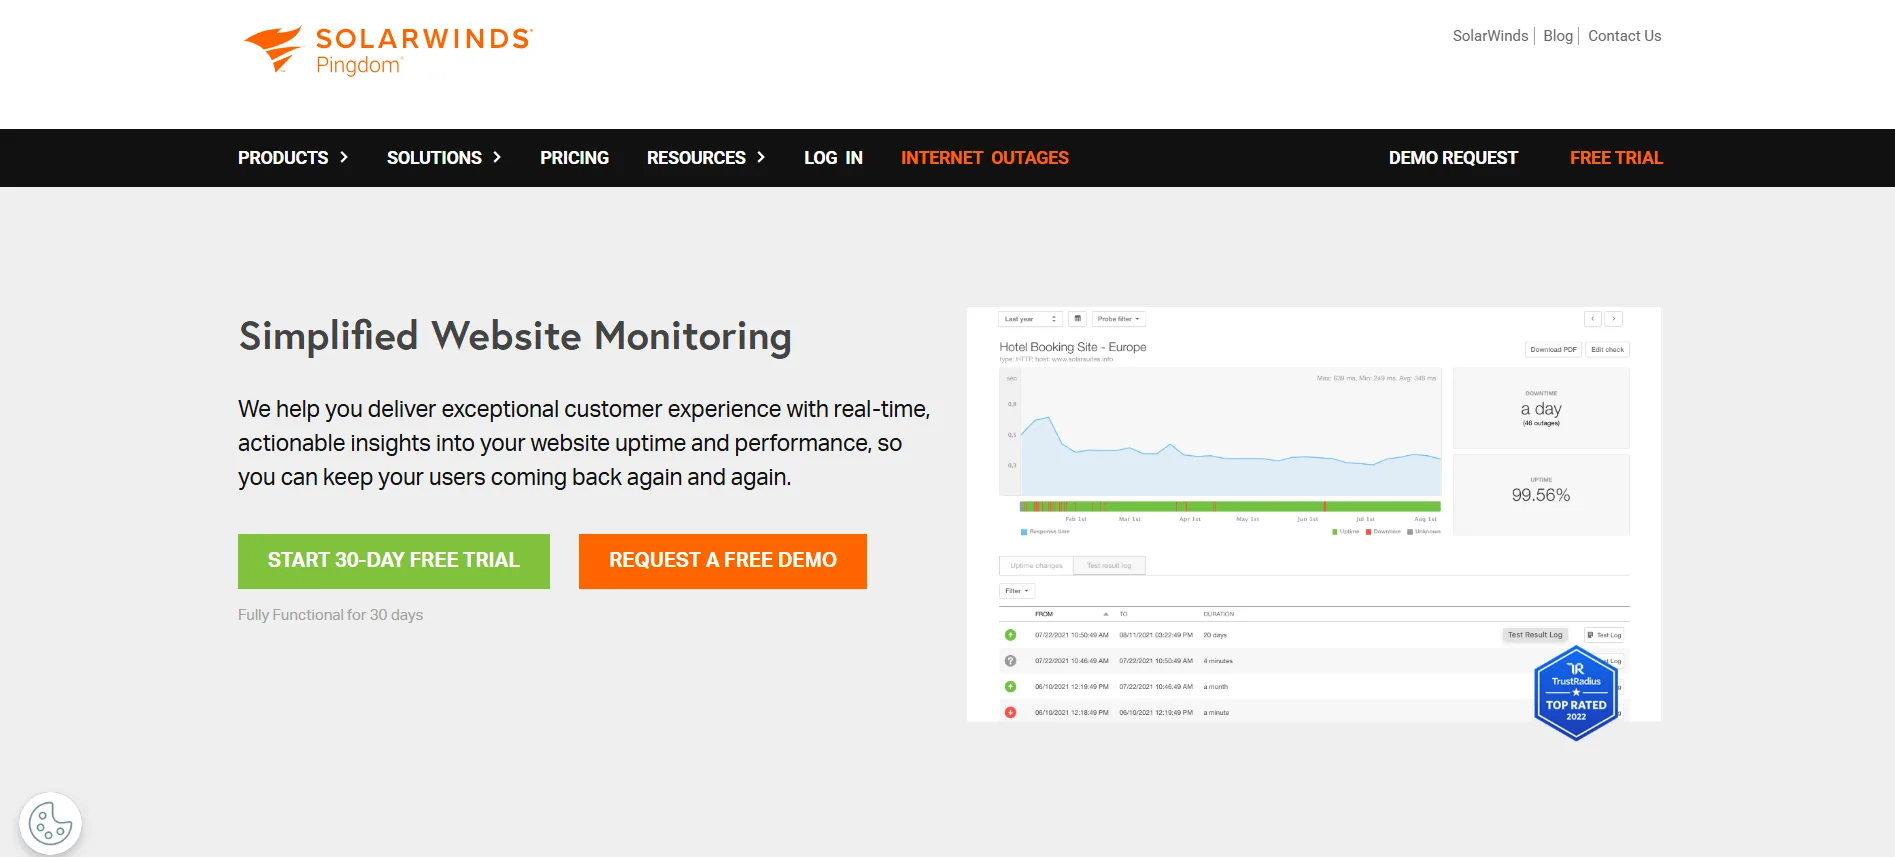
Pingdom specializes in website performance and uptime tracking. It provides synthetic monitoring, real user monitoring and page speed insight.
The platform is very easy to navigate through and has a neat interface. Pingdom is good for those whose primary concern is website performance rather than full monitoring of infrastructure.
Betterstack
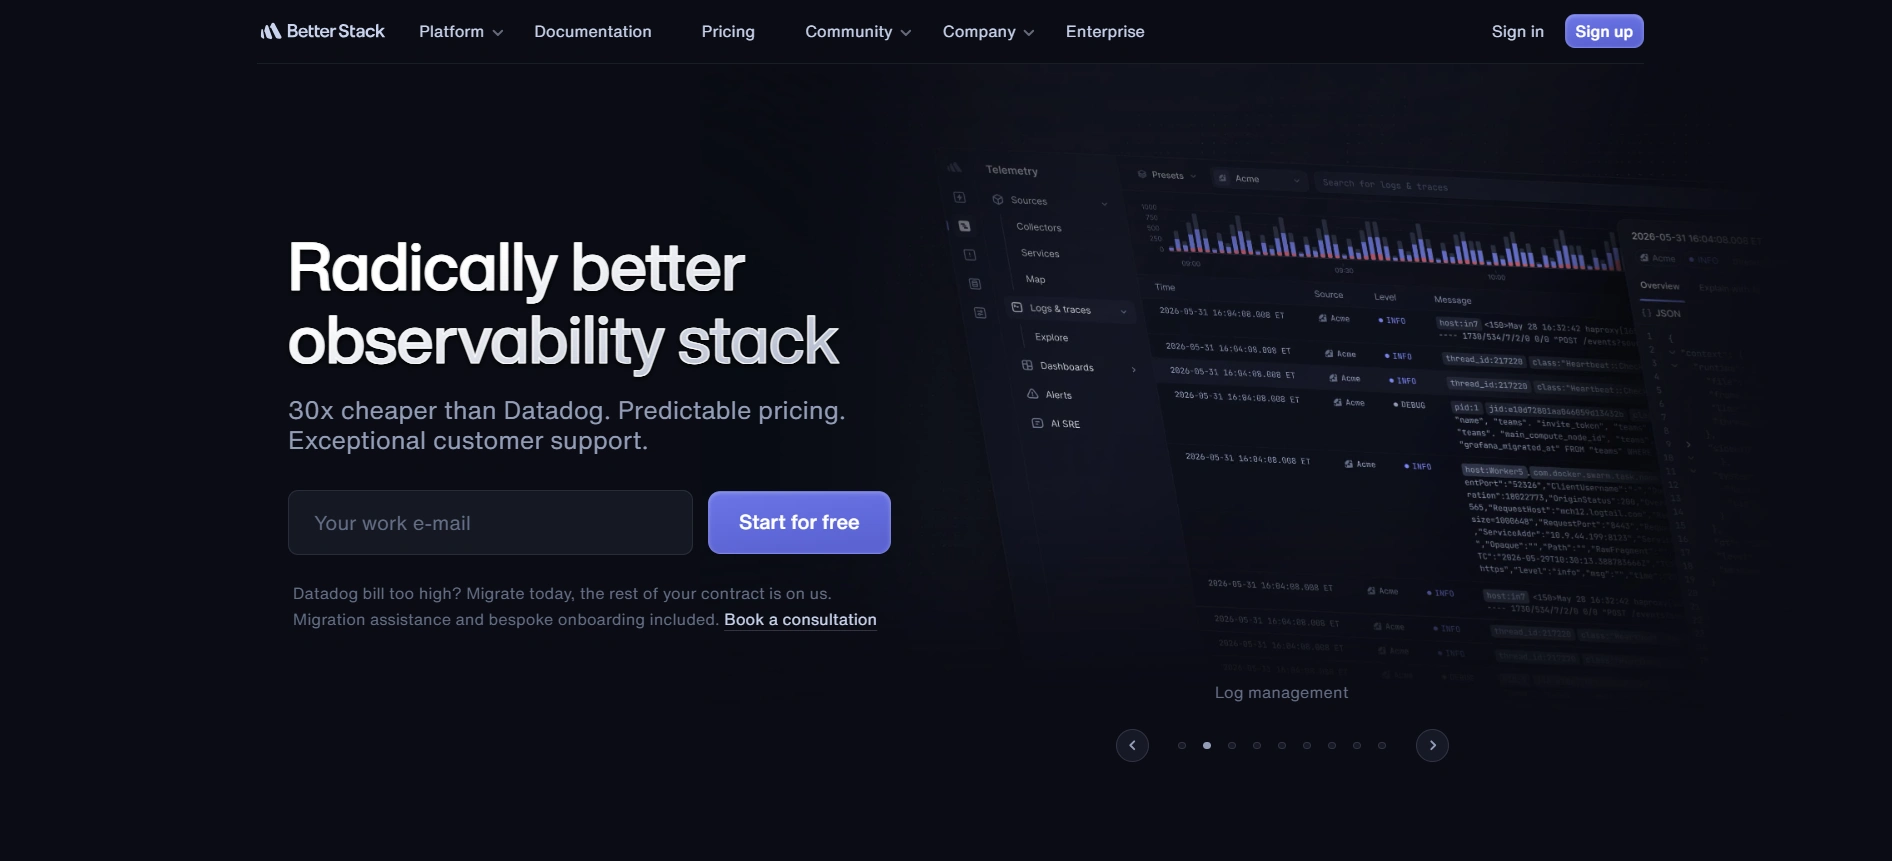
Betterstack combines uptime monitoring, incident management, and status pages in one platform. Their approach emphasizes the complete incident workflow from detection through resolution.
The platform includes log management alongside traditional monitoring. For teams that want monitoring and incident response tightly integrated, Betterstack offers that combination.
Does Application Monitoring Track the Performance of Software Applications in Real-Time?
Yes. Application monitoring tracks software performance as it happens. This real time visibility enables teams to detect and respond to issues immediately.
Application monitors instrument the applications to collect performance data while they are executing. They examine response time, throughput, error rate and resource usage.
Real time monitoring matters because application issues can develop quickly. A memory leak might cause performance to degrade over hours. A configuration error might cause immediate failures. Without real time visibility, teams only learn about problems when users complain.
Modern application monitoring includes alerting based on real time data. When metrics exceed thresholds, alerts notify the responsible team. This enables rapid response before issues impact many users.
Advanced APM solutions follow each request as it makes its way down the application stack and report where time is being spent and when errors are made.
Is Database Monitoring Irrelevant to Application Performance?
Absolutely not. Database monitoring is directly relevant to application performance. Many applications spend a significant portion of their time waiting for database queries to complete.
Slow database queries create slow applications. Missing indexes, inefficient queries, lock contention, connection pool exhaustion. All of these database issues manifest as application performance problems.
Database monitoring tracks query performance, connection usage, lock status, replication lag, and resource consumption. This visibility helps teams optimize database performance, which in turn improves application performance.
Organizations sometimes overlook database monitoring because databases sit behind applications and are not directly user facing. But database problems cause user facing issues. Monitoring the database alongside the application provides complete visibility.
Internal vs External in Website Tracking
Internal vs. External Monitor Website HealthThere are two sides of the coin when evaluating website health, each representing slightly different views. Most organizations need both. With external monitoring your site is monitored from outside of your network, in the same way regular users would access it.
This reveals problems that affect public access. If there is a network issue between your data center and the internet, external monitoring catches it.
Internal monitoring runs from within your network or infrastructure. It observes what’s going on behind the firewall. Internal monitoring can reach internal-only endpoints and can catch problems that are only possible in your private abusing environment. Imagine you have a healthy webserver but your firewall is blocking traffic.
Internal monitoring shows everything working. External monitoring indicates the site is down. Both perspectives are necessary.
External monitoring also tests from multiple geographic locations. Your site could be fast in the US, but slow in Europe.
External monitoring from diverse locations reveals these geographic performance differences.
Internal monitoring often goes deeper into infrastructure components. Application internals, database connections, internal APIs. These details matter for troubleshooting but are not visible from outside.
A complete monitoring strategy uses both. External monitoring confirms public availability and performance. Internal monitoring provides detailed visibility into infrastructure and application components.
Does DevOps Monitoring Provide Insights for Faster Website Updates and Fixes?
Yes. Monitoring in a DevOps setting builds loops of feedback that speed up development as well as operations.
When a teams releases a change, they see the results immediately in their monitoring. Did the deployment improve performance? Did it introduce errors? Did it affect availability? The feedback is so immediate that teams can basically validate (or not) success, or just as rapidly back out.
Monitoring data informs development priorities. When observation reveals that one particular capability is causing the majority of errors, developers can spend time improving that area. Data replaces guesswork.
Live monitoring via CI/CD pipelines detects problems in time to halt production. Automated tests and observed data finds problems early — where the cost to fix it is lower.
Incident post-mortems are based on monitoring. For figuring that one out—what happened, when it began and what changed—a high degree of observability is necessary. Such data leads to the developments that avoid similar occurrences in future.
DevOps is all about collaboration between development and operations. Shared monitoring dashboards lead to shared understanding. All the data is visible to everyone and everyone works toward the same goals.
Does Containerization Improve Resource Efficiency for Websites with High Traffic?
Containerization can be more resource efficient, but only with good packaging and implementation.
Containers include applications and their dependencies that run in their own environments. This allows for effective utilization of resources since several containers can coexist in a single host and share hardware without nor hindering each other.
If you have a high traffic site, containers are great for horizontal scaling. As traffic grows, orchestration systems such as Kubernetes can spawn more containers. They can scale down when traffic declines. This elasticity adjusts resources to demand.
Container orchestration also improves resilience. If a container goes down, the orchestration system starts another one right away. The higher-traffic site that elicits this) is better off for it.
However, containerization adds complexity. The methods for monitoring containers are not the same as what you’re accustomed to with standard servers. Enterprises require insight across container health, resource utilisation, and orchestration states.
The economic benefits of containerization are useless if the technology is improperly applied. Ill-configured containers sometimes do the inverse of saving resources. Observability is required to make sure containers provide the benefits that are promised.
Can Observability Help Prevent Website Downtime by Identifying Issues Early?
Observability absolutely helps prevent downtime. The basic concept of observability is being able to grok what the system does well enough that you can tell something bad is about to happen before an outage occurs.
Traditional monitoring answers known questions. Is the server up? Is response time acceptable? Observability takes this a step further — empowering teams to solve problems they didn’t even know existed by digging into the behavior of their systems.
Warning signs often come relatively early in the process of putting up a blackout. Error rates could creep up over time. Memory consumption might grow slowly. The queue depths may increase with time. Observability platforms bring these trends to the surface and allow for preventative action.
Observability platforms with anomaly detection can recognize abnormal patterns without hard-coded thresholds. If the behaviour of a system goes outside the norm, alerts trigger even if no single rule has been breached.
Metrics, logs, and traces are the three legs to observability that work together. Metrics show quantitative patterns. Logs provide detailed event information. Traces illustrate the progress of requests in distributed systems. Taking them together brings to light problems either perspective might overlook.
Companies with good observability practices tend to be less surprised. They discover issues early and bring them under control before users become aware.
How to Choose Log Monitoring Tools for Small Businesses
Small businesses have different needs than enterprises. Log monitoring tools should match those needs without excessive cost or complexity.
Start by understanding what you need to monitor. A simple website on shared hosting has different logging needs than a custom application on cloud infrastructure. Identify which logs matter for your situation.
Consider volume. Enterprise log management tools price based on data volume. Small businesses with modest log volumes might find these tools prohibitively expensive. Look for options with generous free tiers or flat pricing.
Evaluate ease of use. Small teams cannot dedicate full time staff to managing monitoring tools. Choose solutions that are straightforward to set up and operate.
Cloud-based tools often work well for small businesses. They eliminate the need to manage log storage infrastructure. Data is accessible from anywhere, and scaling is automatic.
Some tools combine log monitoring with other capabilities. For small teams that want consolidated monitoring, these all in one solutions reduce complexity.
Free and open source options exist but require more technical expertise to operate. If your team has the skills, these tools can be cost effective. If not, managed services might save time despite their cost.
What is IOT Monitoring?
IOT monitoring covers everything from who is online and when, to what they're doing together. That could be sensors and video cameras, industrial equipment and home appliances, or whatever other connected gadgets you’re using.
IOT monitoring presents unique challenges. Devices can be widely distributed. They also work on the constrained end with scant resources. Connectivity might be intermittent. The traditional methods of monitoring do not always directly apply to IOT based systems.
Good IOT monitoring also tracks device status, battery levels, sensor readings, firmware versions and other metrics relevant to each type of device.
Monitoring the actual devices is important for those websites that communicate with IOT devices or present data from IOT components. If sensors that collect data to feed a dashboard go offline, the dashboard is worthless. Whole system monitoring, devices not the website!
With respect to security monitoring for IOT, this is of even greater concern. IOT representationSourceInsecure by designSome IOT devices are commonly known targets for attackers who hijack them to create botnets or use them as a foothold into corporate networks.
How to Monitor Blockchain?
Blockchain surveillance observes the well-being and use of blockchain protocols and applications.
For public blockchains, observability means watching transaction volume, confirmation latencies, network contention and node health. The organizations running blockchain nodes watch over those nodes the same way they keep an eye on any other piece of infrastructure.
In blockchain applications, the integration points (where other systems can connect) must be monitored. If a blockchain gets bogged down, transactions could take longer or cost more. Through monitoring we see these conditions.
Smart contract surveillance monitors the performance of blockchain applications. The consequences of not testing go beyond “it doesn't work”: smart contracts with bugs can leak both ether and user private data.
Companies which hold cryptocurrencies typically watch wallet balances and transactional transfer flow as a security measure. Unauthorized transactions could mean that private keys have been exposed to compromise.
Blockchain monitoring software is more specific when compared to general website monitoring software. Those companies that are heavily reliant on the blockchain layer may need to consider specialized monitoring tools for it.
How Can Tools Be Compared for Monitoring Solutions?
To compare monitoring tools, you need to know what you want. Some features the would matter for one entity would not make a difference for another.
Begin with a list of must haves features. What monitoring are you looking for? What integrations are required? How large of a scale does this tool need to be able to work under?
Evaluate pricing carefully. Monitoring costs can vary dramatically. Some tools bill by the host, some by the data volume, others by feature tier. How costs scale with your growth.
Consider operational burden. Some tools are expensive to install and maintain. Others are fully managed. The best option depends on what your team can handle and is good at.
Test before committing. Free trials are available on the majority of monitoring tools. “Use trials to understand end user experience and feedback, alert quality, and level of support responsiveness.”
Look for vendor stability. Monitoring is a critical function. Switching tools is disruptive. Select vendors that are likely to stay in business and keep on developing their products.
Look for reviews from businesses like yours. The monitoring requirements depend on the industry, company size and technical environment. Custom reviews from other similar companies are more valuable than generic feedback.
Monitoring 101: Basics of Website and System Monitoring
For those new to monitoring, here are the fundamental concepts. When it comes to monitoring, the first step is deciding what you want to watch. Find what systems, third parties or measures are relevant to your case.
Build checks that ensure those systems function as they should. The test doesn't have to be complicated—it can be as basic as pinging a server and as involved as running synthetic transaction scripts. Define what normal looks like. Create benchmarks for measures such as response time, error rate and resource usage. Deviations from normal trigger alerts.
Set up the alerts that matter, delivered to the people who need them, through the appropriate channels. Alerts should be actionable. It generates valueless noise if nobody can answer the alert. Generate dashboards that provide overview of the current status with at a glance information. Dashboards give teams a sense of overall health and the ability to drill into issues as they arise. Store historical data. Trends over time expose patterns not detected by point-in-time snapshots and are valuable for post event forensics analysis. Review and refine regularly. Monitoring requirements change with systems. Realign checks, thresholds and dashboards to reflect current reality.
Start simple and expand. Any simple “Are you alive?” check is infinitely better than none. Once you know what counts, complicate. RIP is not "fire and forget" either. Without continual maintenance, it will not support your health. But that investment really pays off in reliability, performance and peace of mind.