Adding a Resource Monitor Dashboard
Learn to monitor server health with our resource monitoring guide. Set up CPU, memory, and disk tracking with custom thresholds and get alerts before performance issues occur.
1 Access Your Dashboard
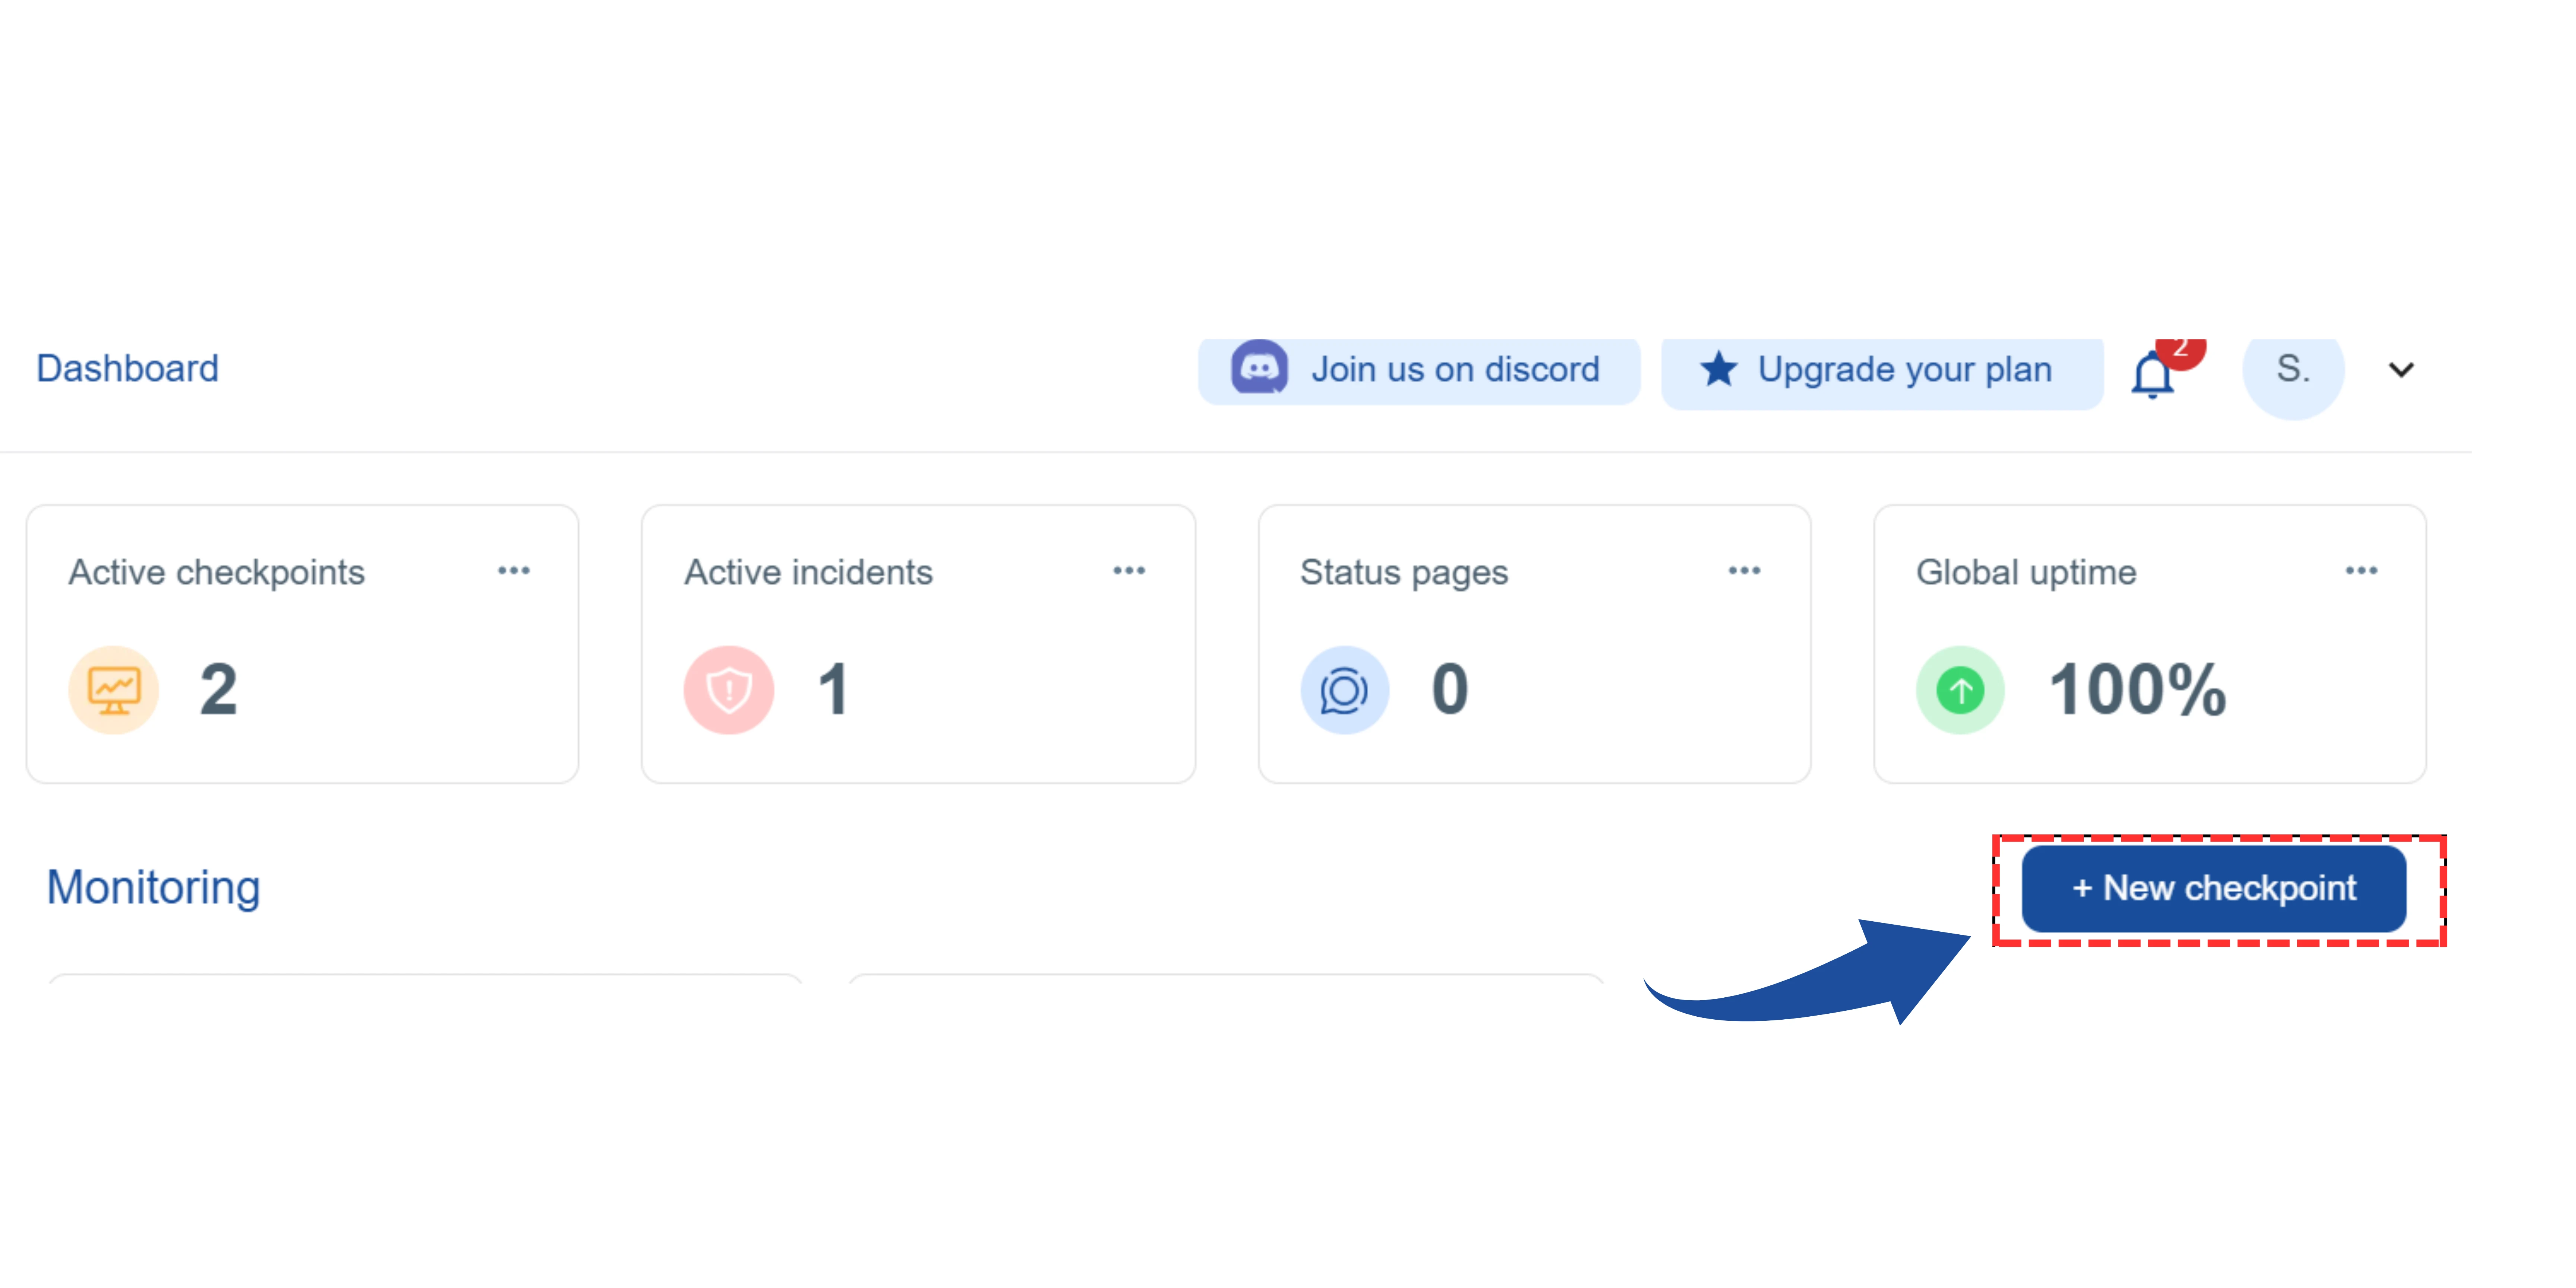
On your main dashboard, you will see the "New Checkpoint" button. Click on it.
2 Select the Checkpoint Type
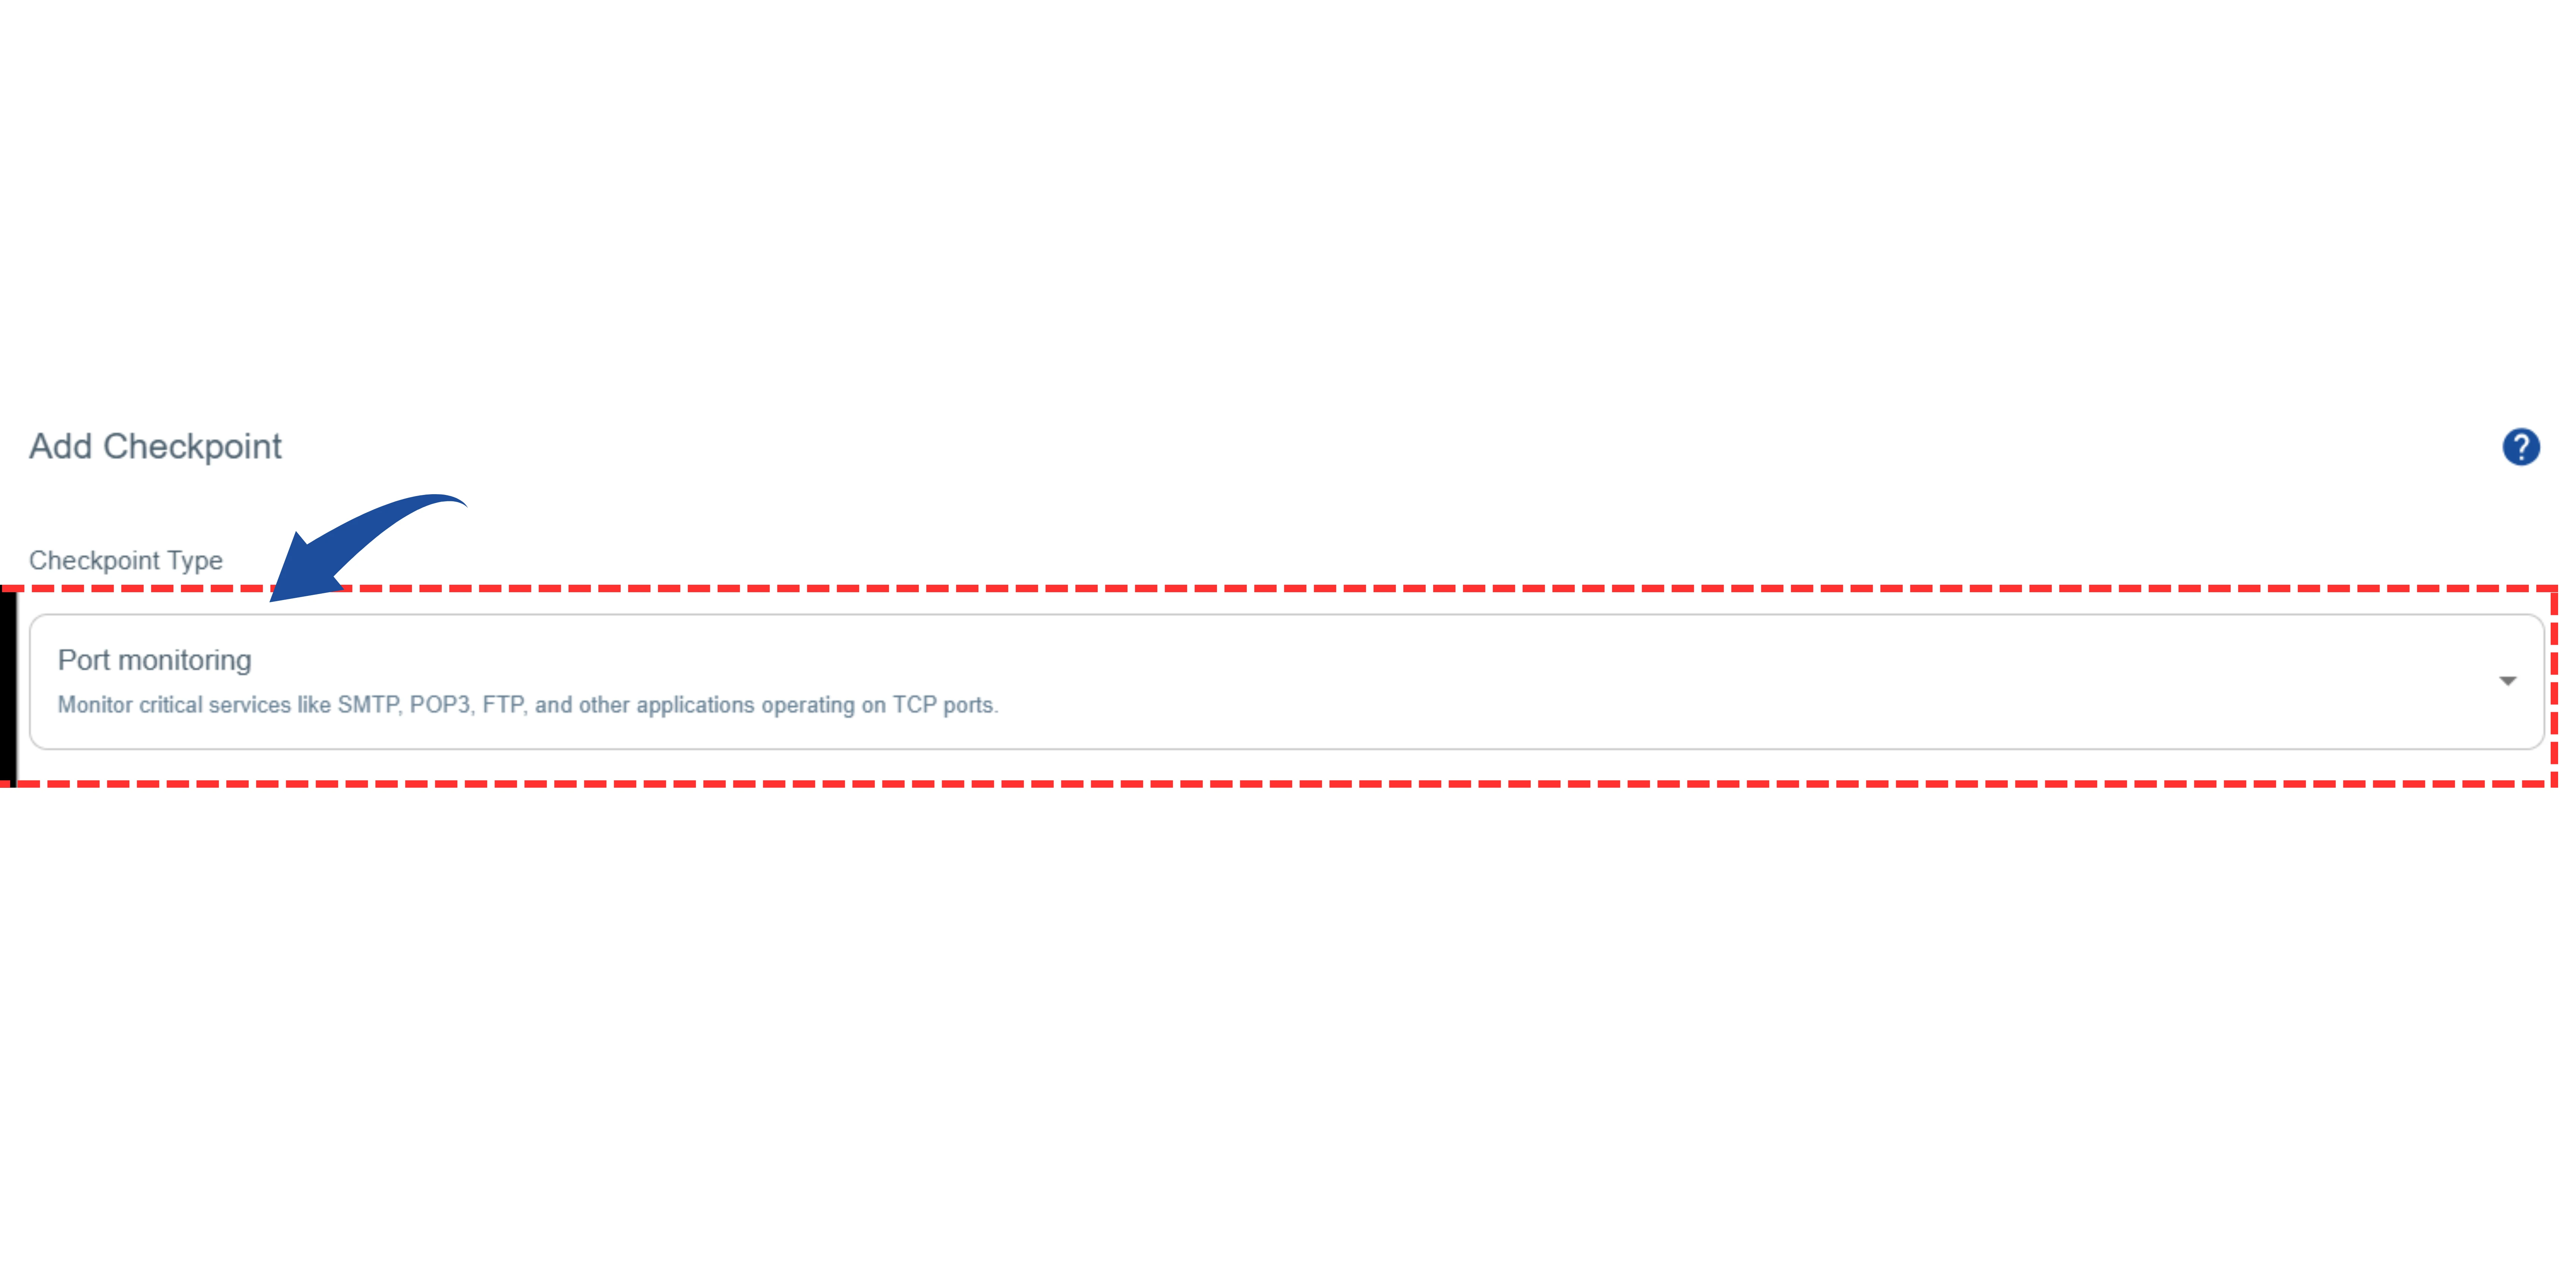
You will be redirected to the"Add Checkpoint" page.
This type of monitor tracks system resources such as CPU, Memory, Disk, and Network Usage to ensure your server is performing optimally.
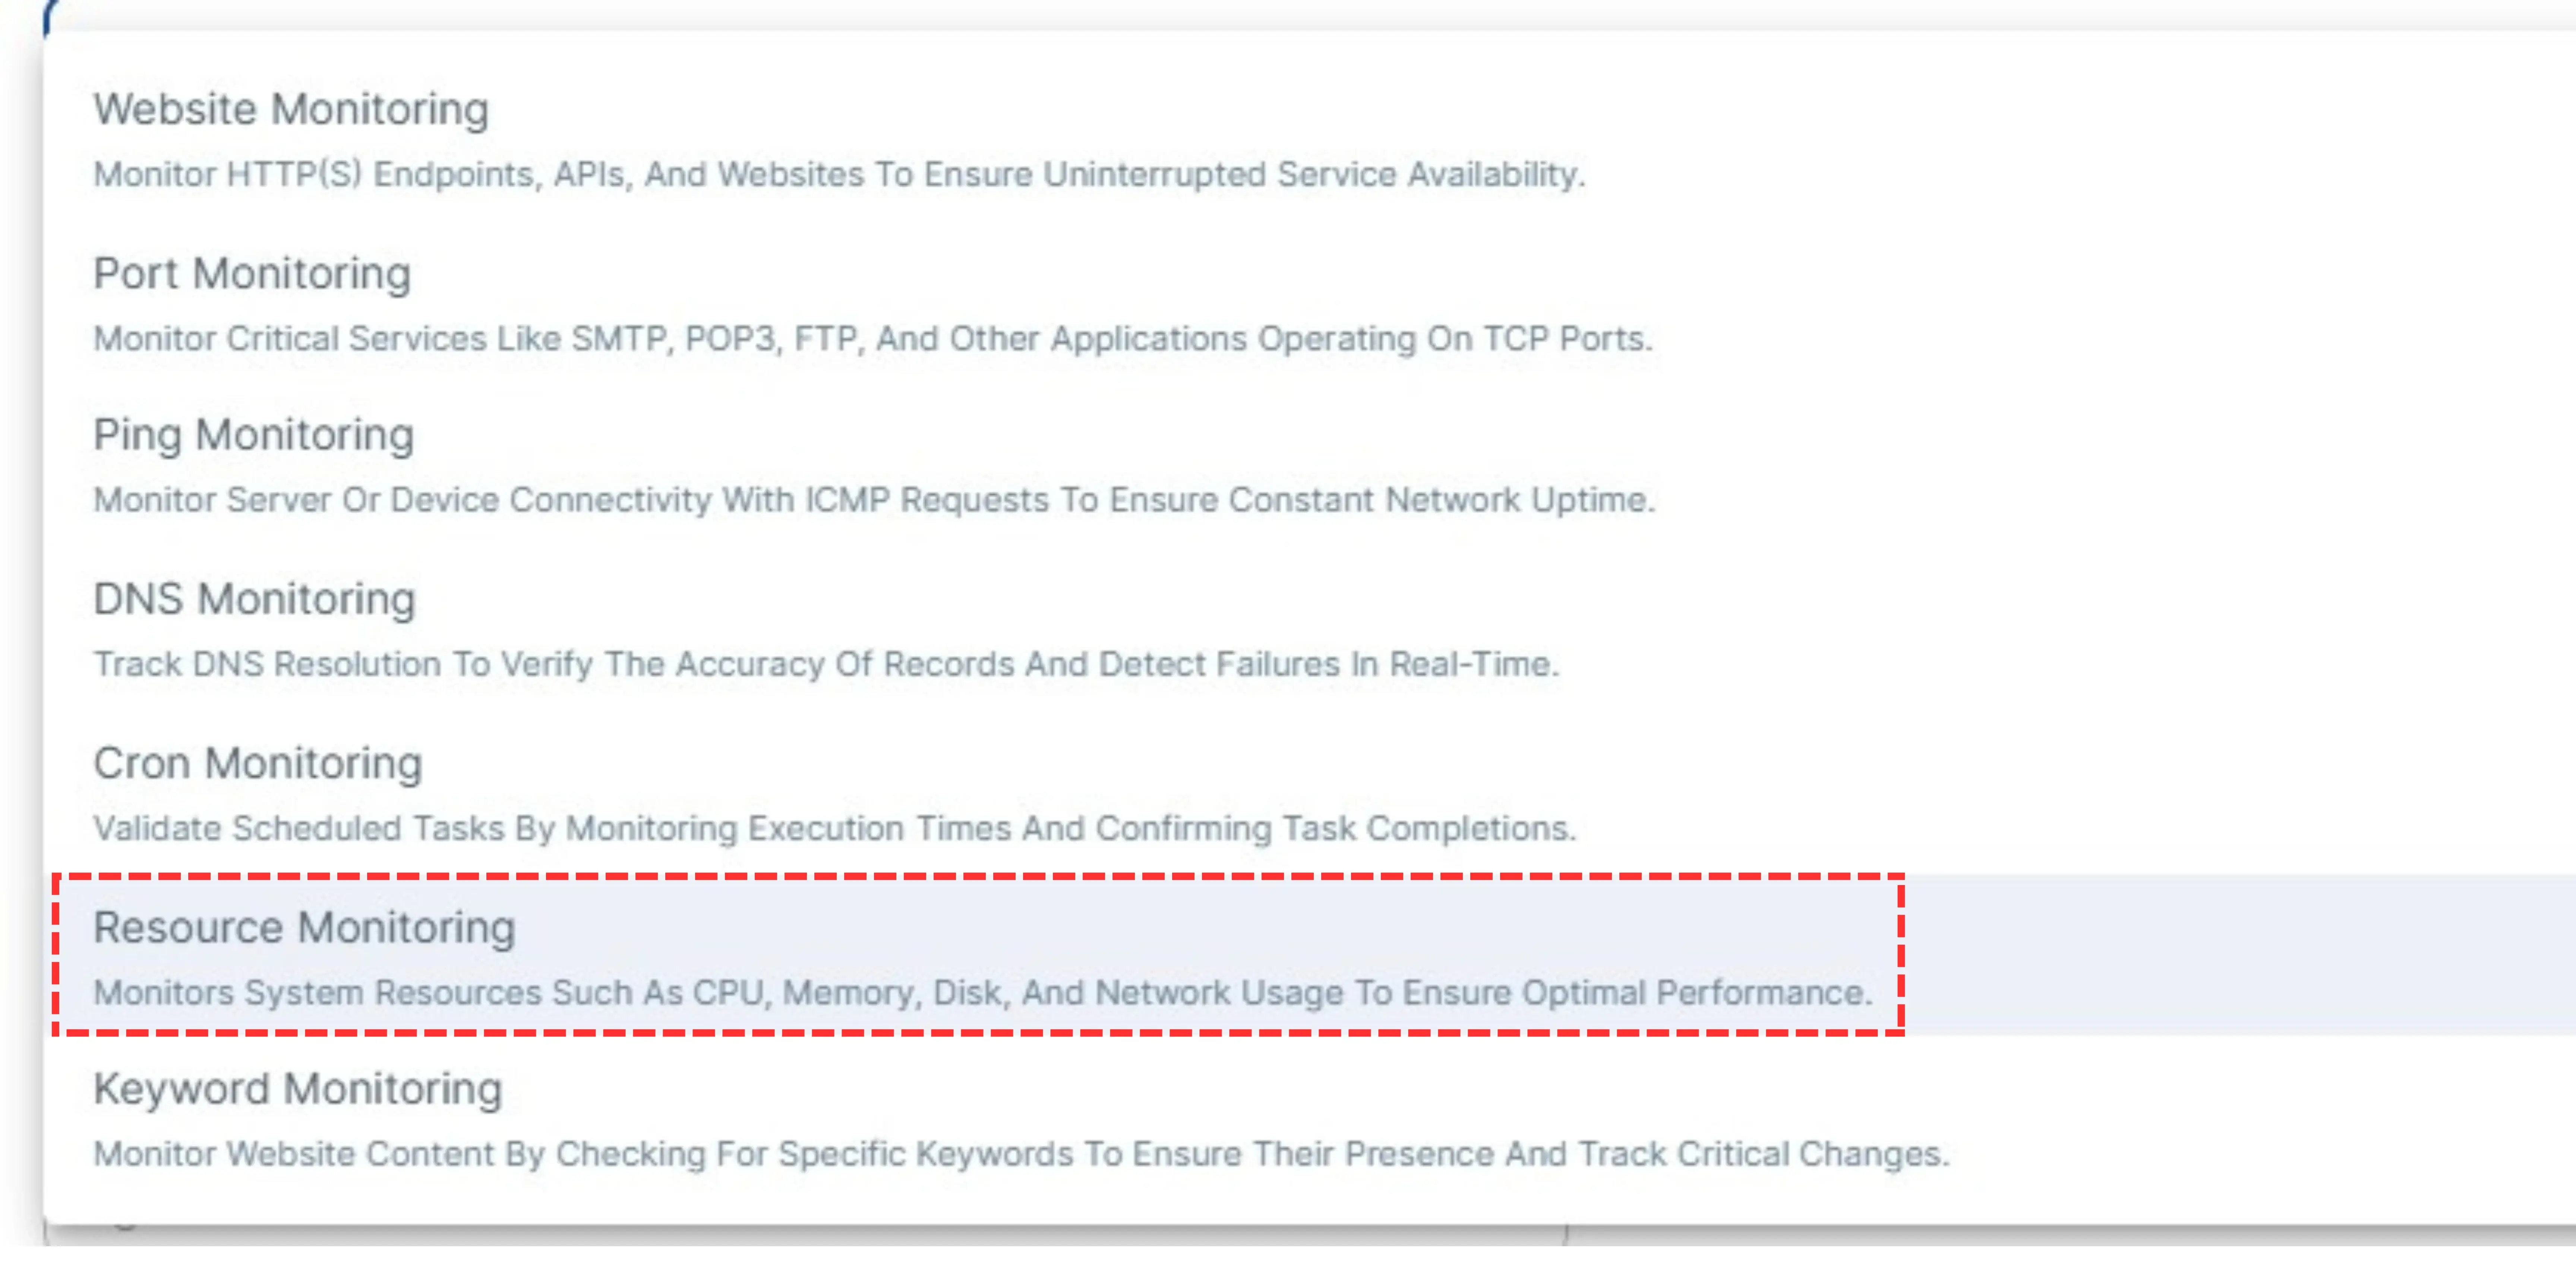
Under"Checkpoint Type" , select "Resource Monitoring".
3 Name Your Monitor & Select OS
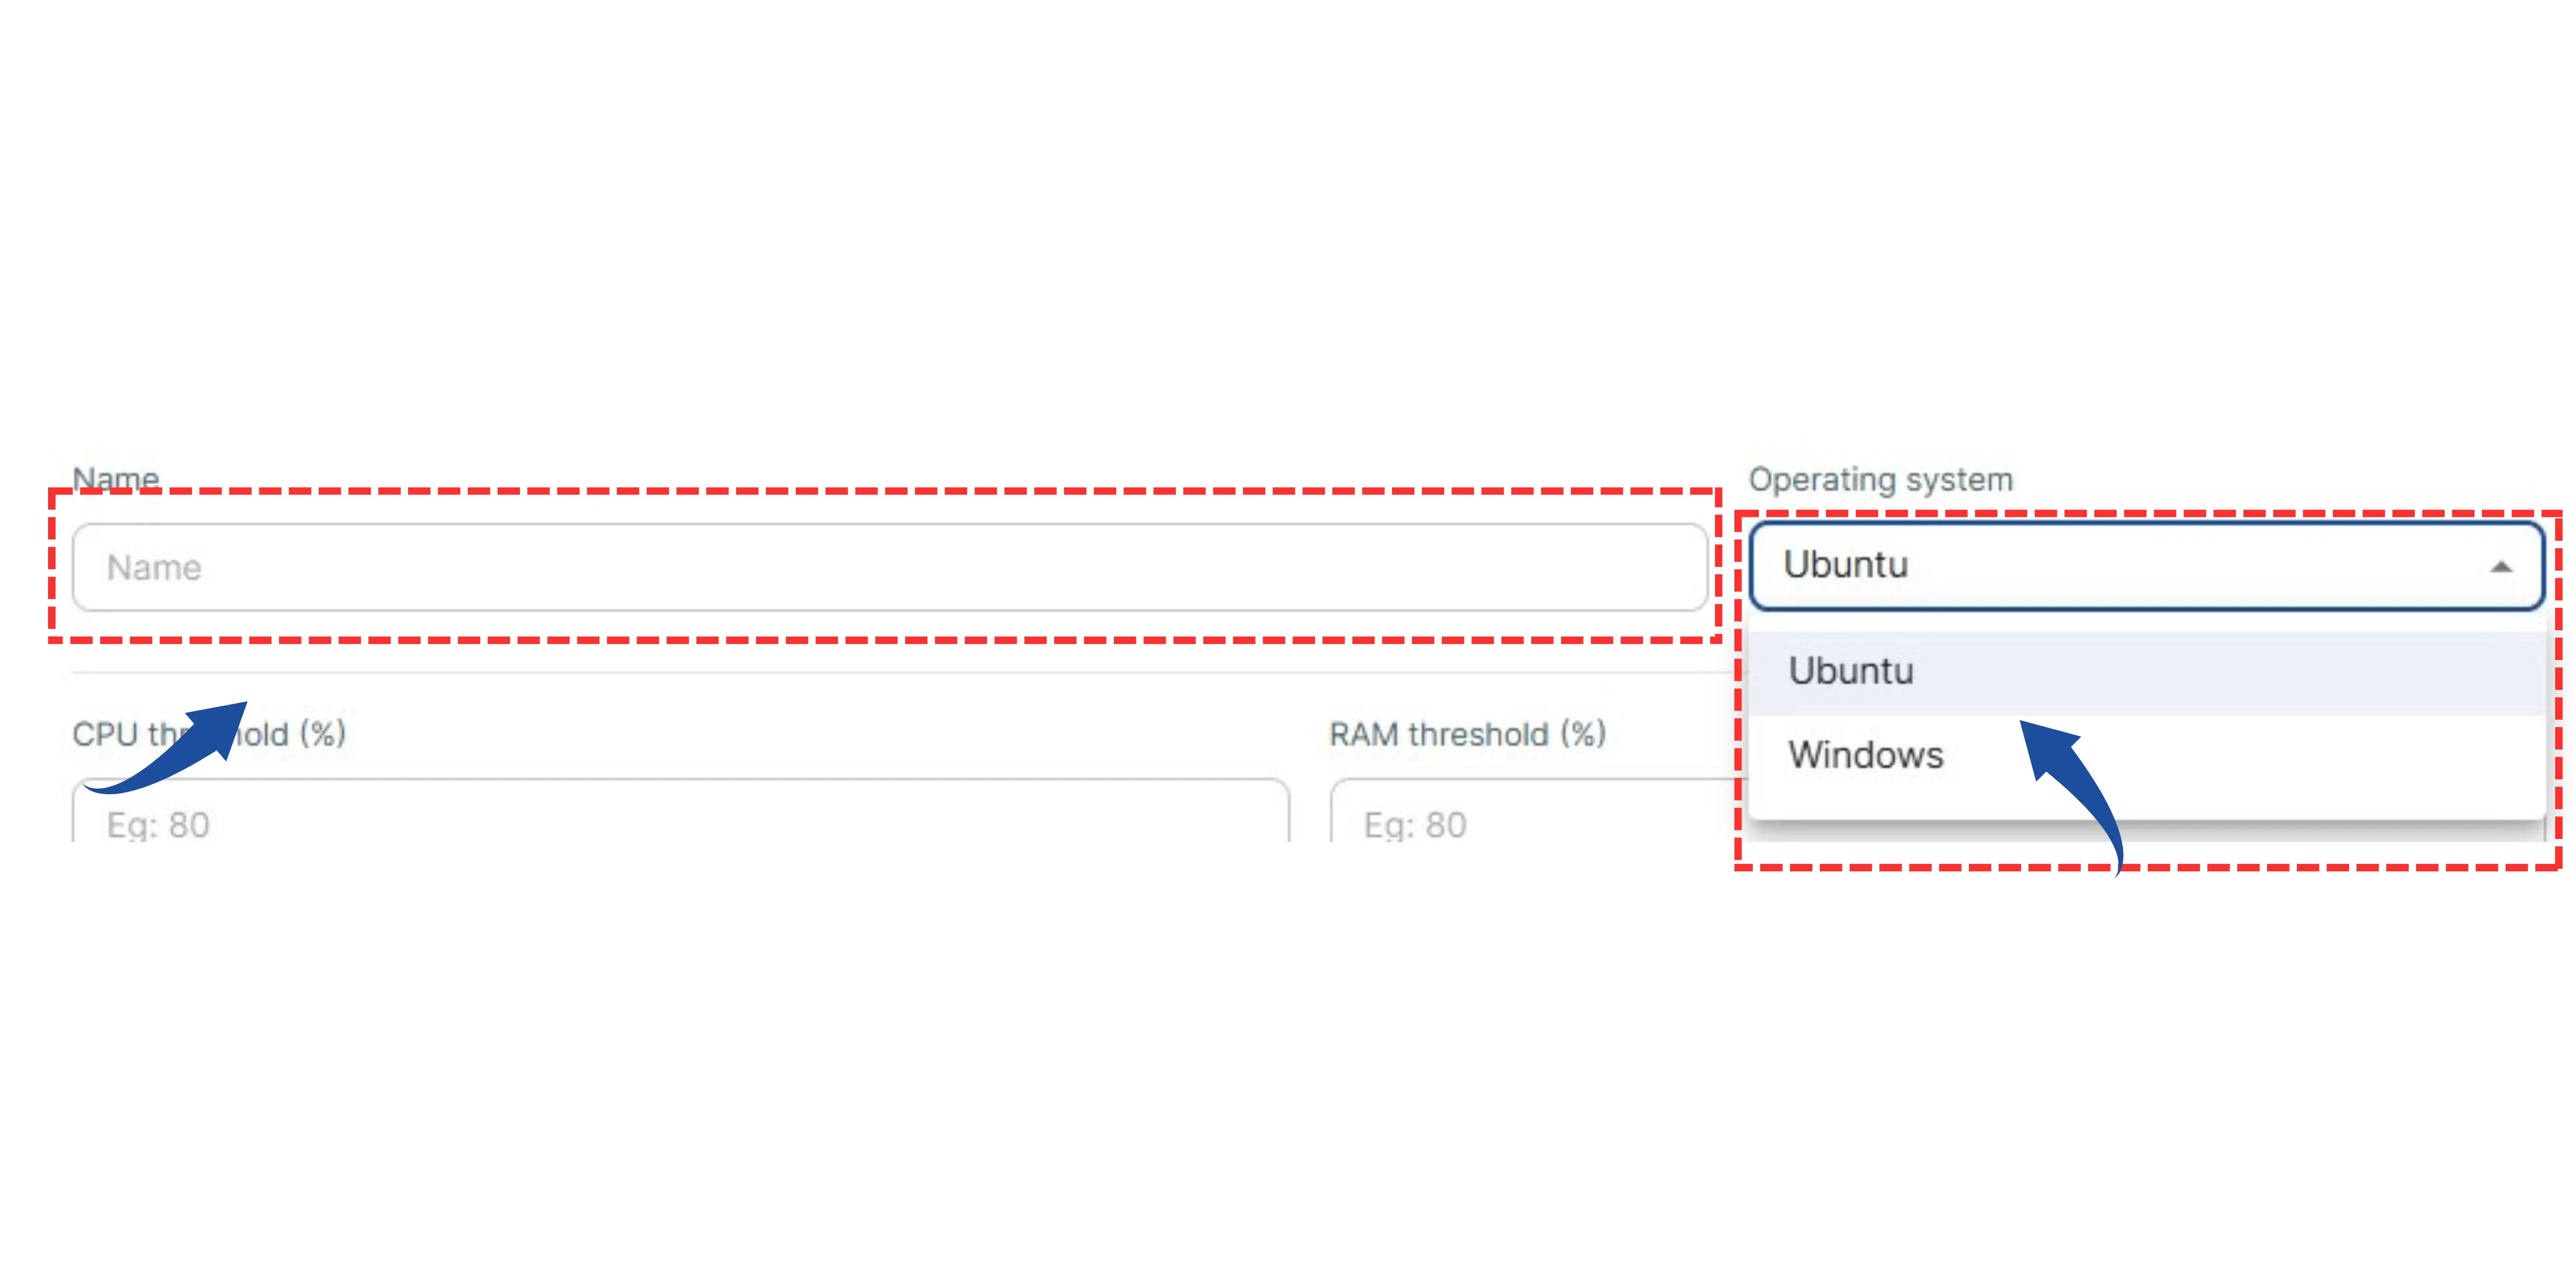
Give a recognizable name to this resource monitor (e.g., "CPU Load").
Select the Operating System of the server you are monitoring from the dropdown (e.g., Ubuntu or Windows).
4 Set Resource Thresholds (Part 1)
Define the critical levels at which you want to be alerted. When usage crosses these thresholds, an alert will be triggered.
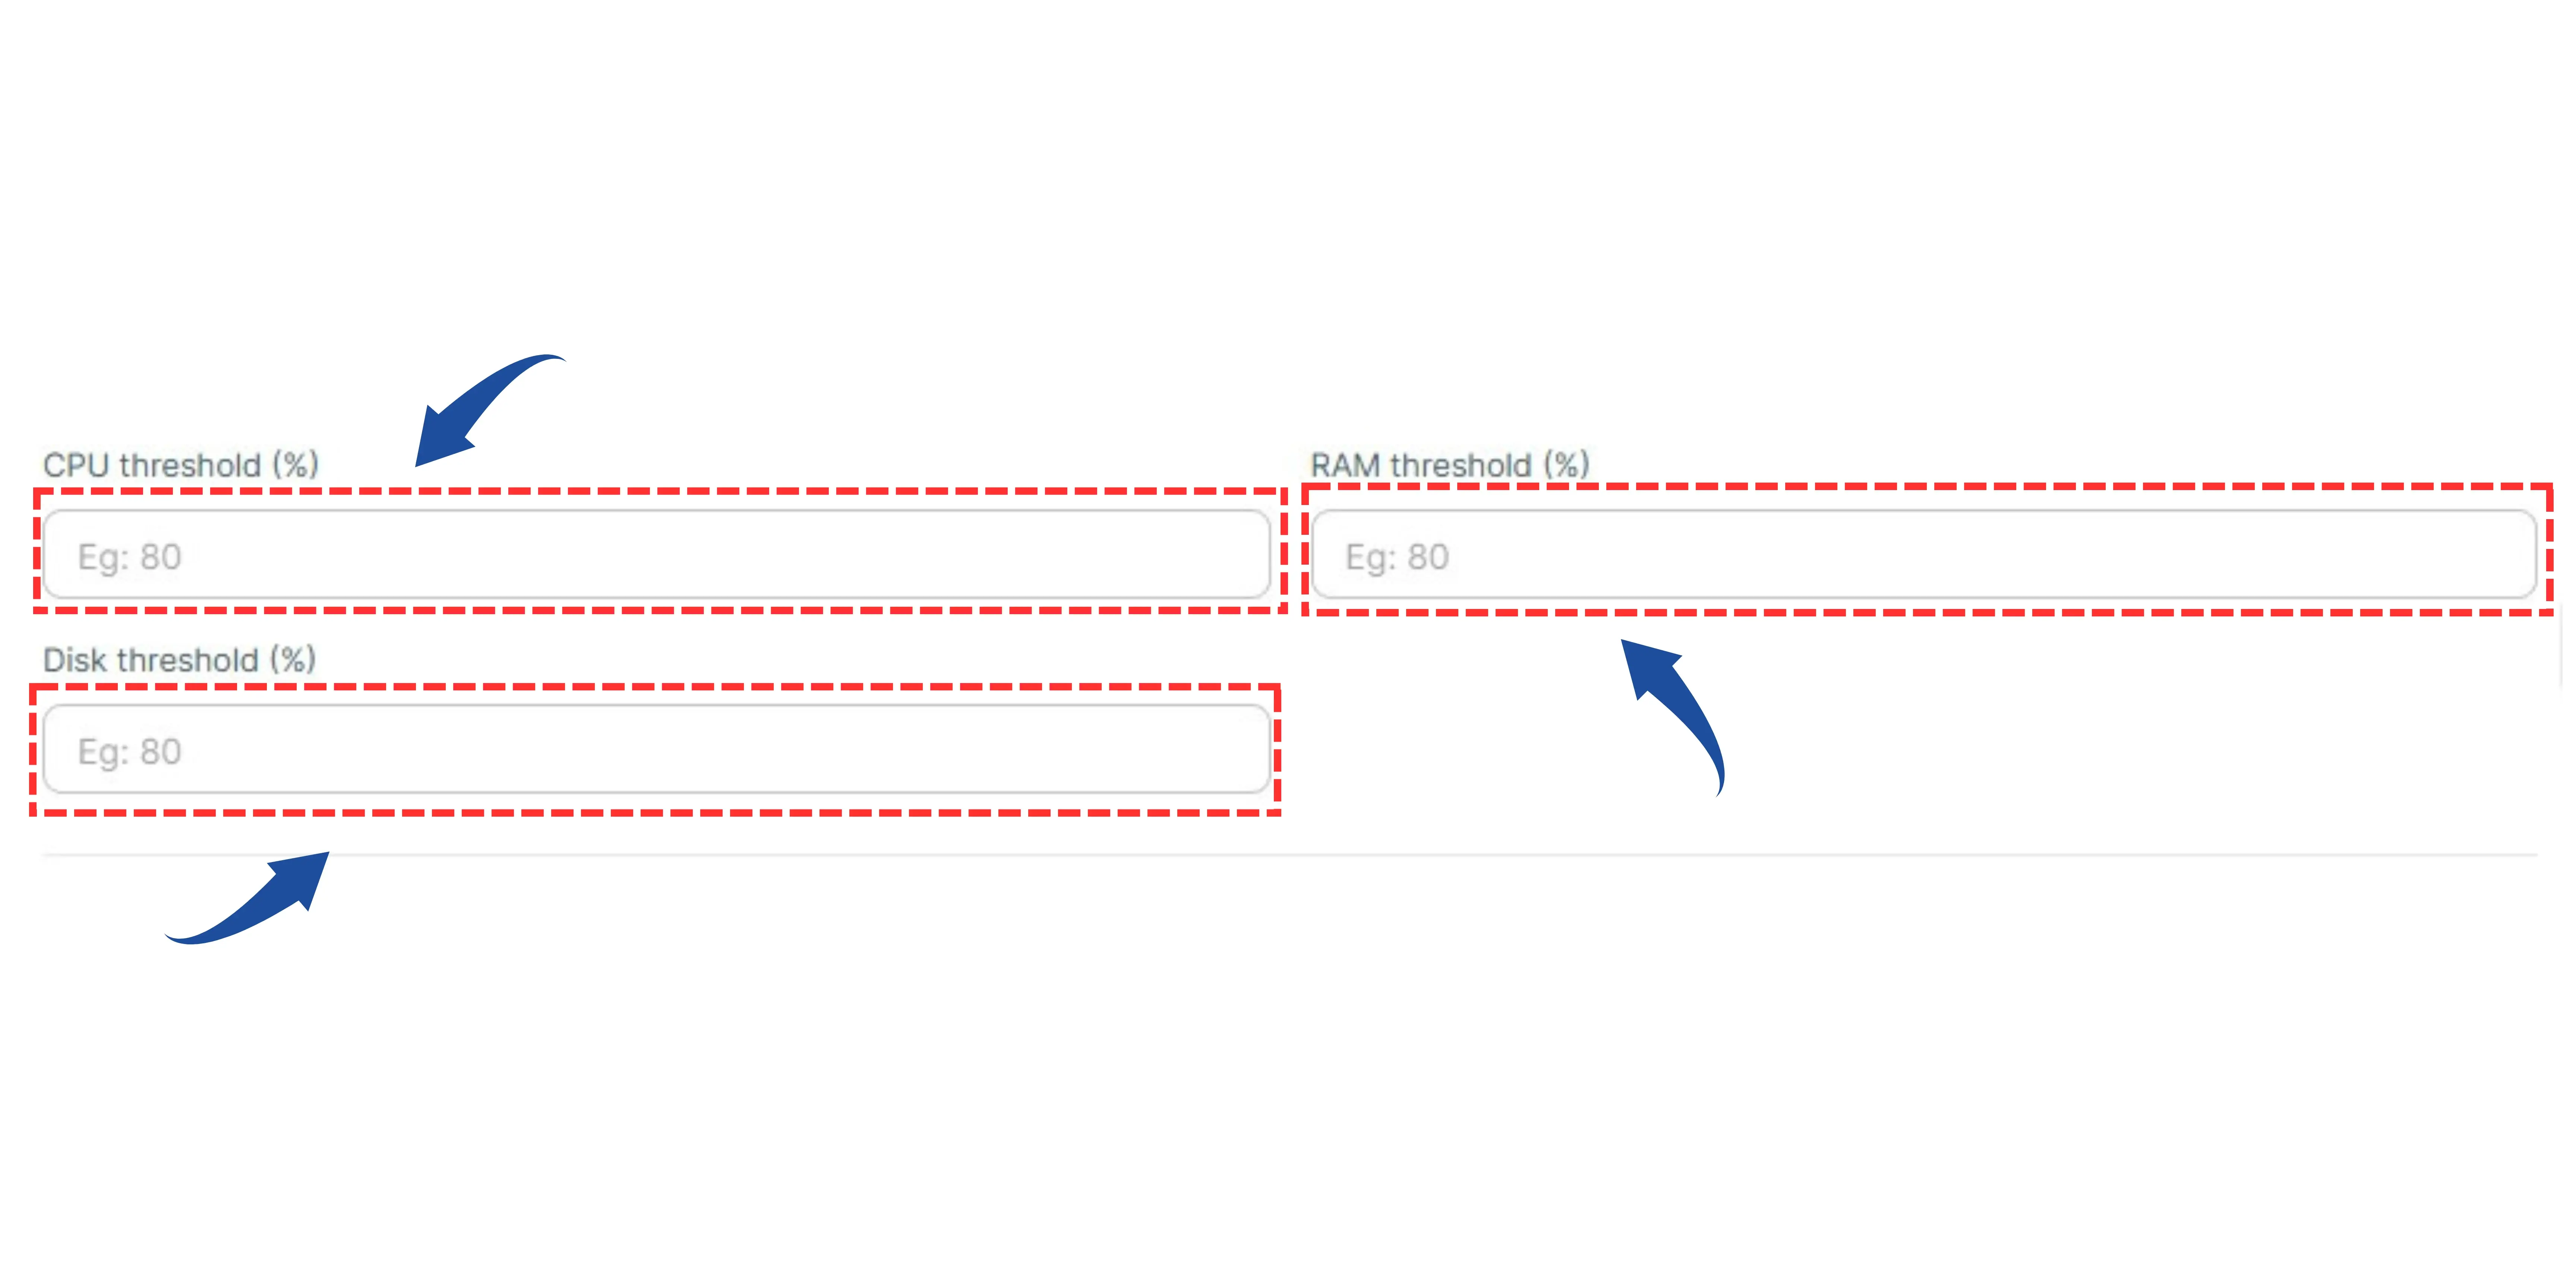
- CPU Threshold (%): Set the maximum CPU usage percentage (e.g., 80%).
- Disk Threshold (%): Set the maximum disk usage percentage (e.g., 80%).
- RAM Threshold (%): Set the maximum memory usage percentage (e.g., 80%).
5 Set Resource Thresholds (Part 2)
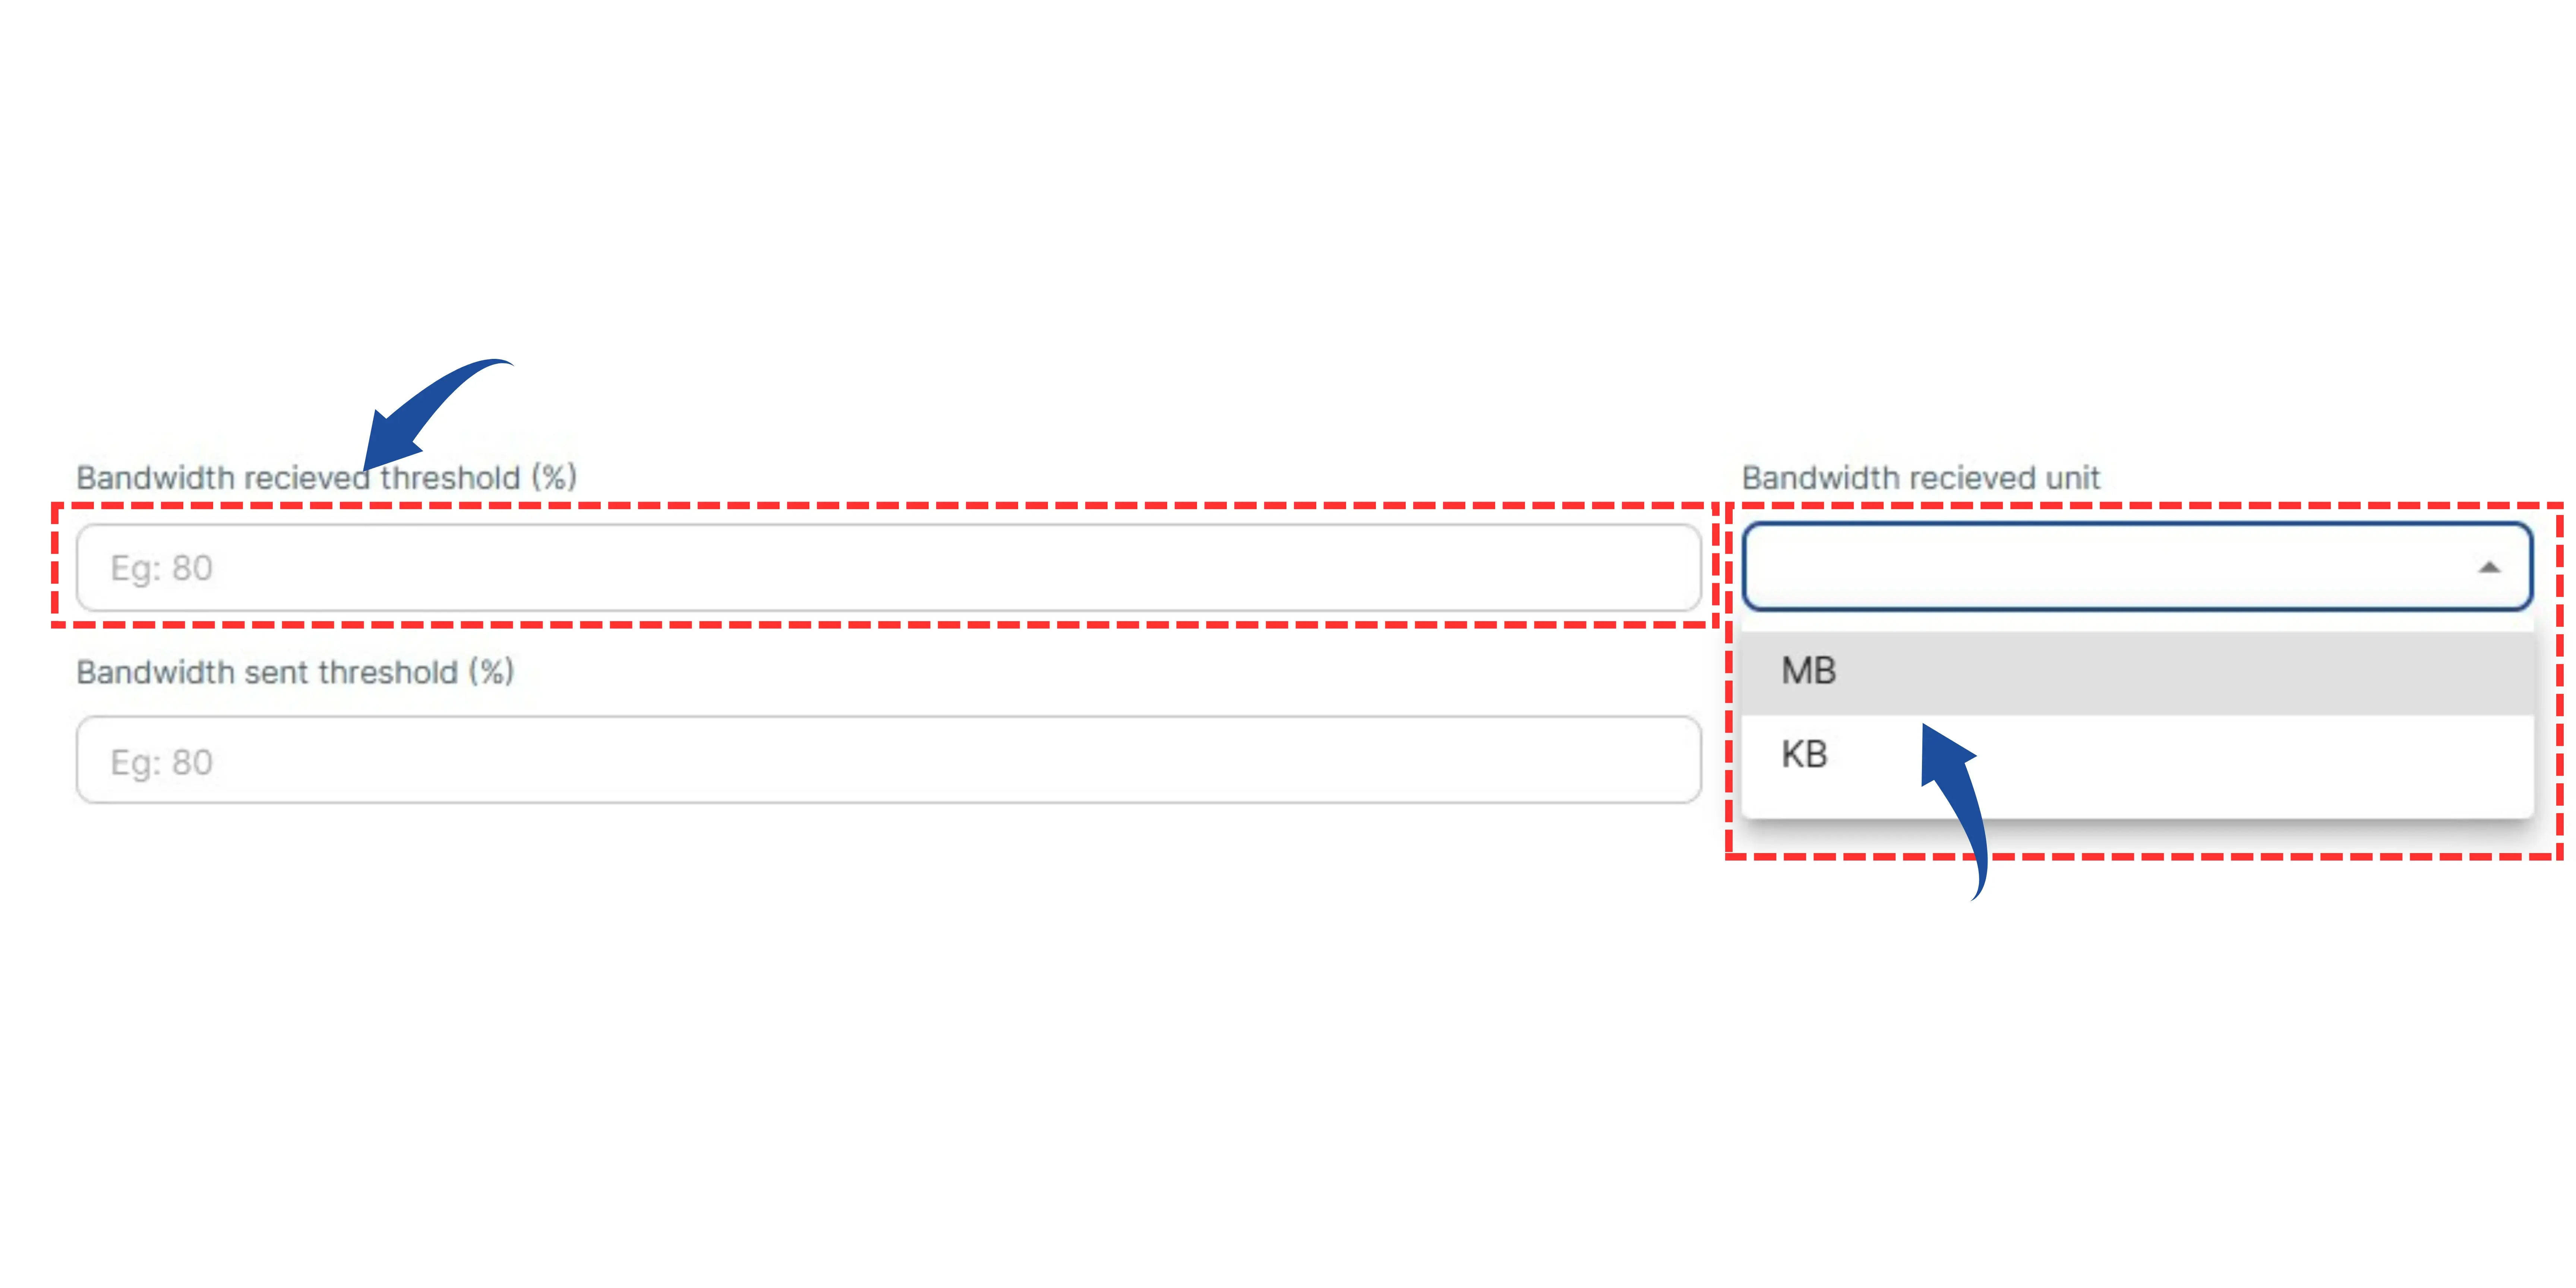
Bandwidth Received Threshold (%): Set the maximum allowed percentage for incoming bandwidth.
Bandwidth Received Unit: Select the unit for this measurement (e.g., MB or KB).
6 Set Bandwidth Sent Threshold
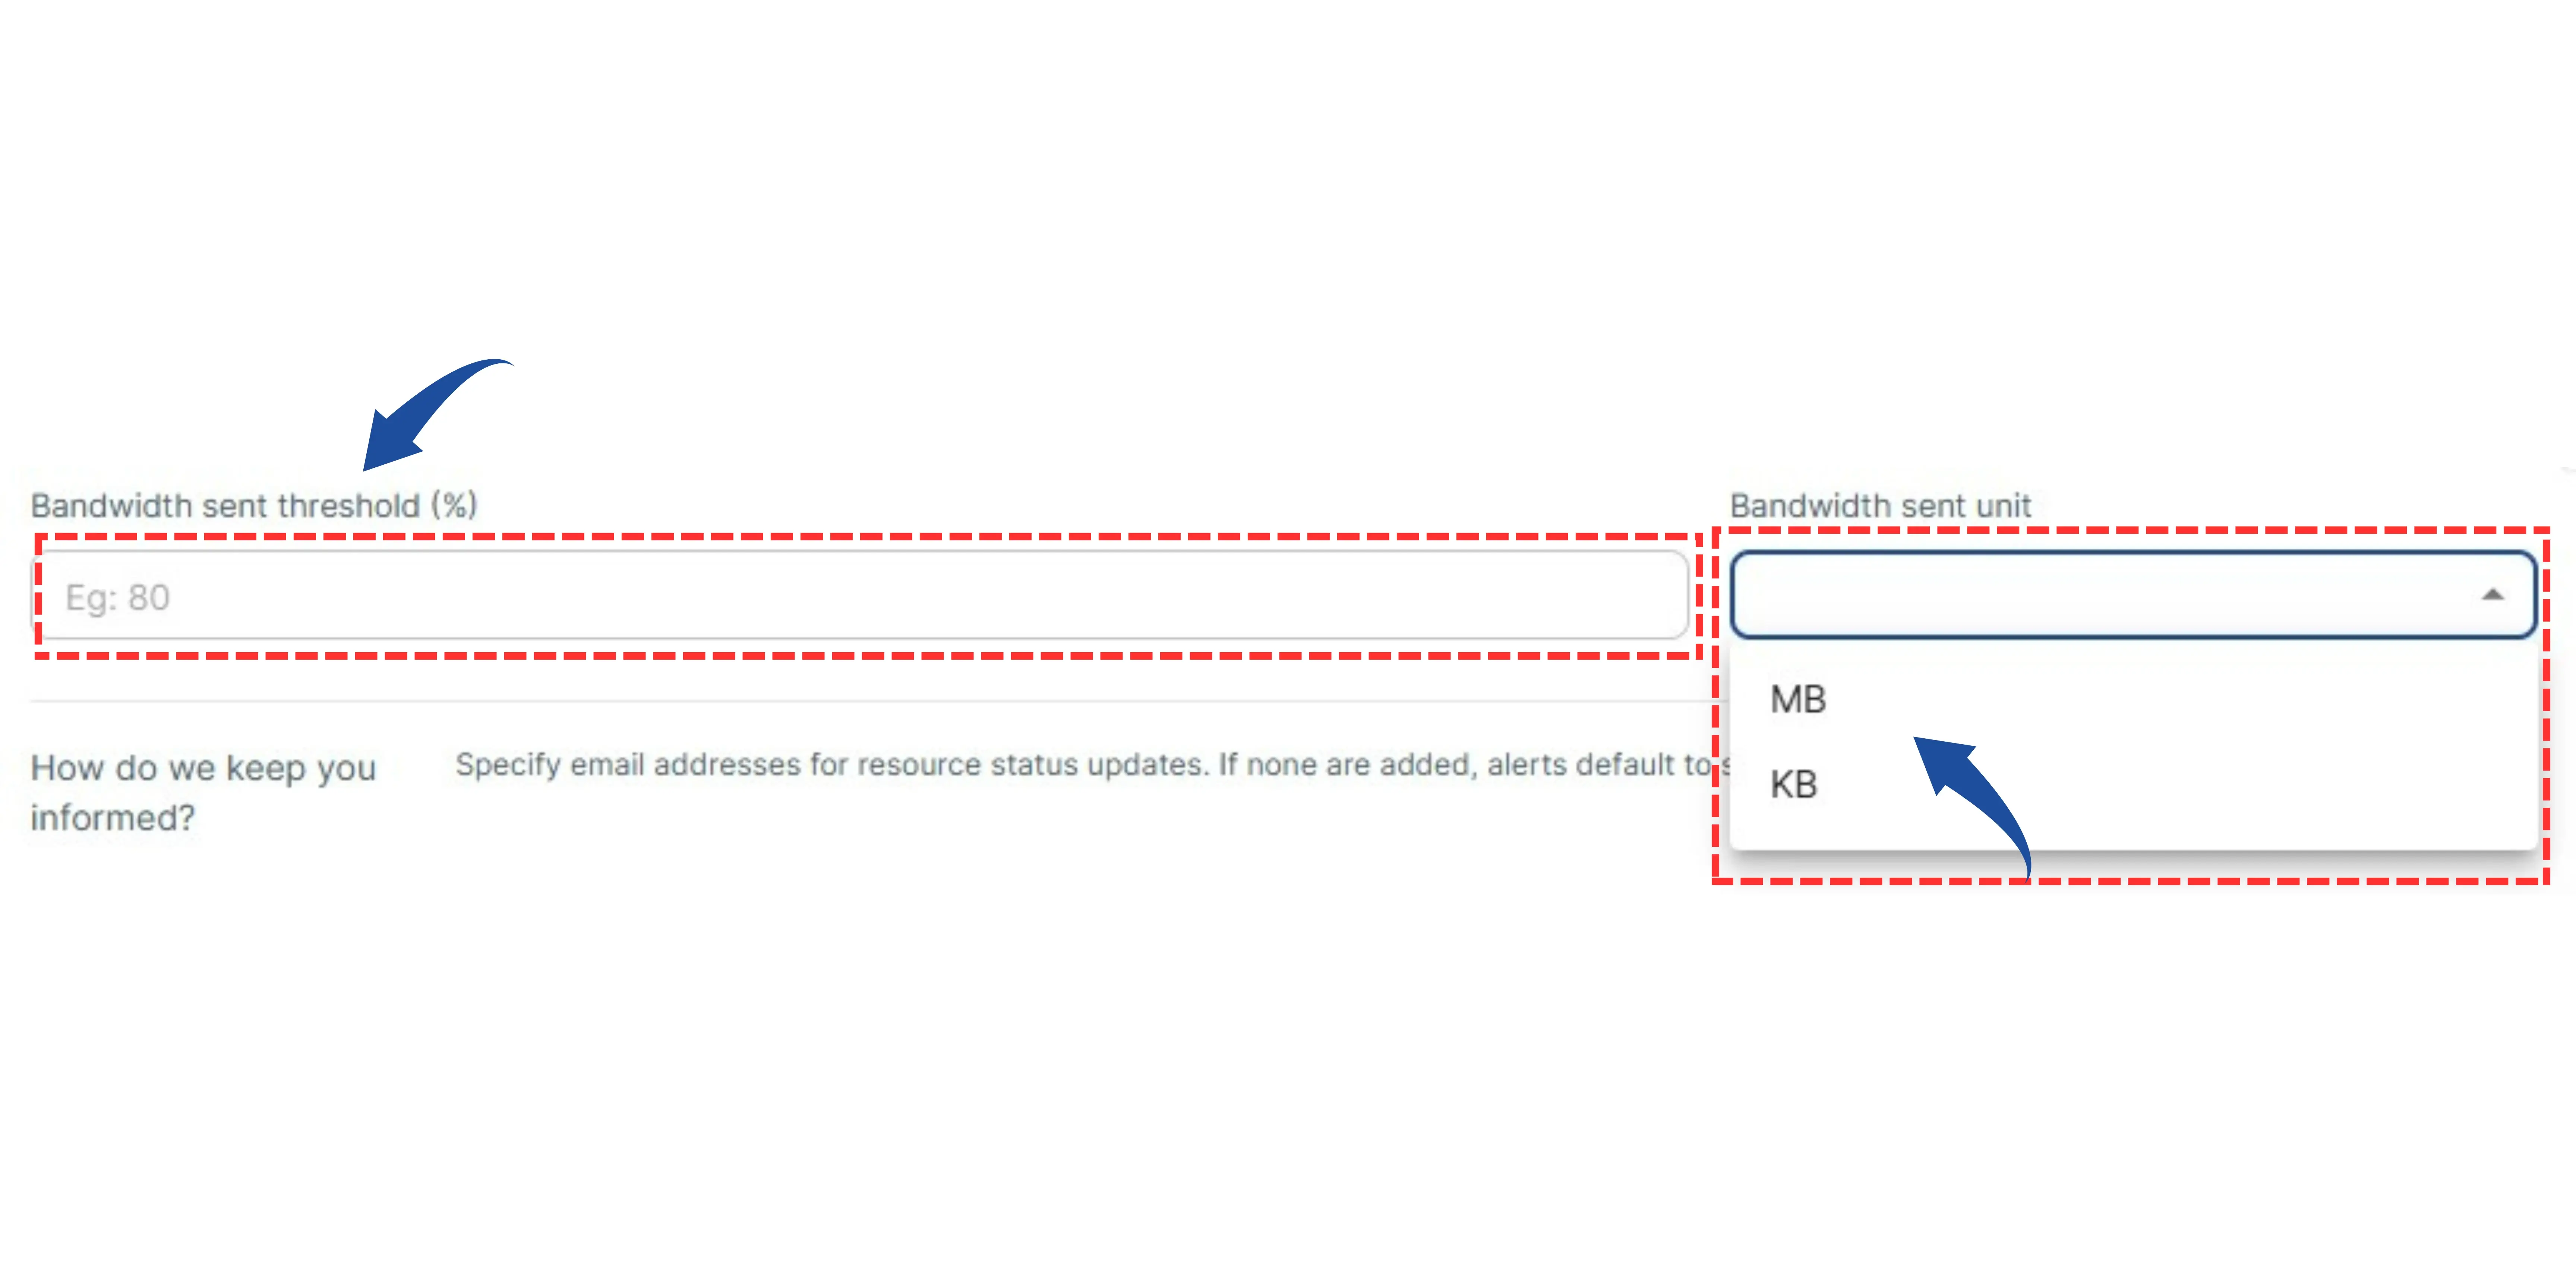
Bandwidth Sent Threshold (%): Set the maximum allowed percentage for outgoing bandwidth.
Bandwidth Sent Unit: Select the unit for this measurement (e.g., MB or KB).
7 Set Up Alert Notifications
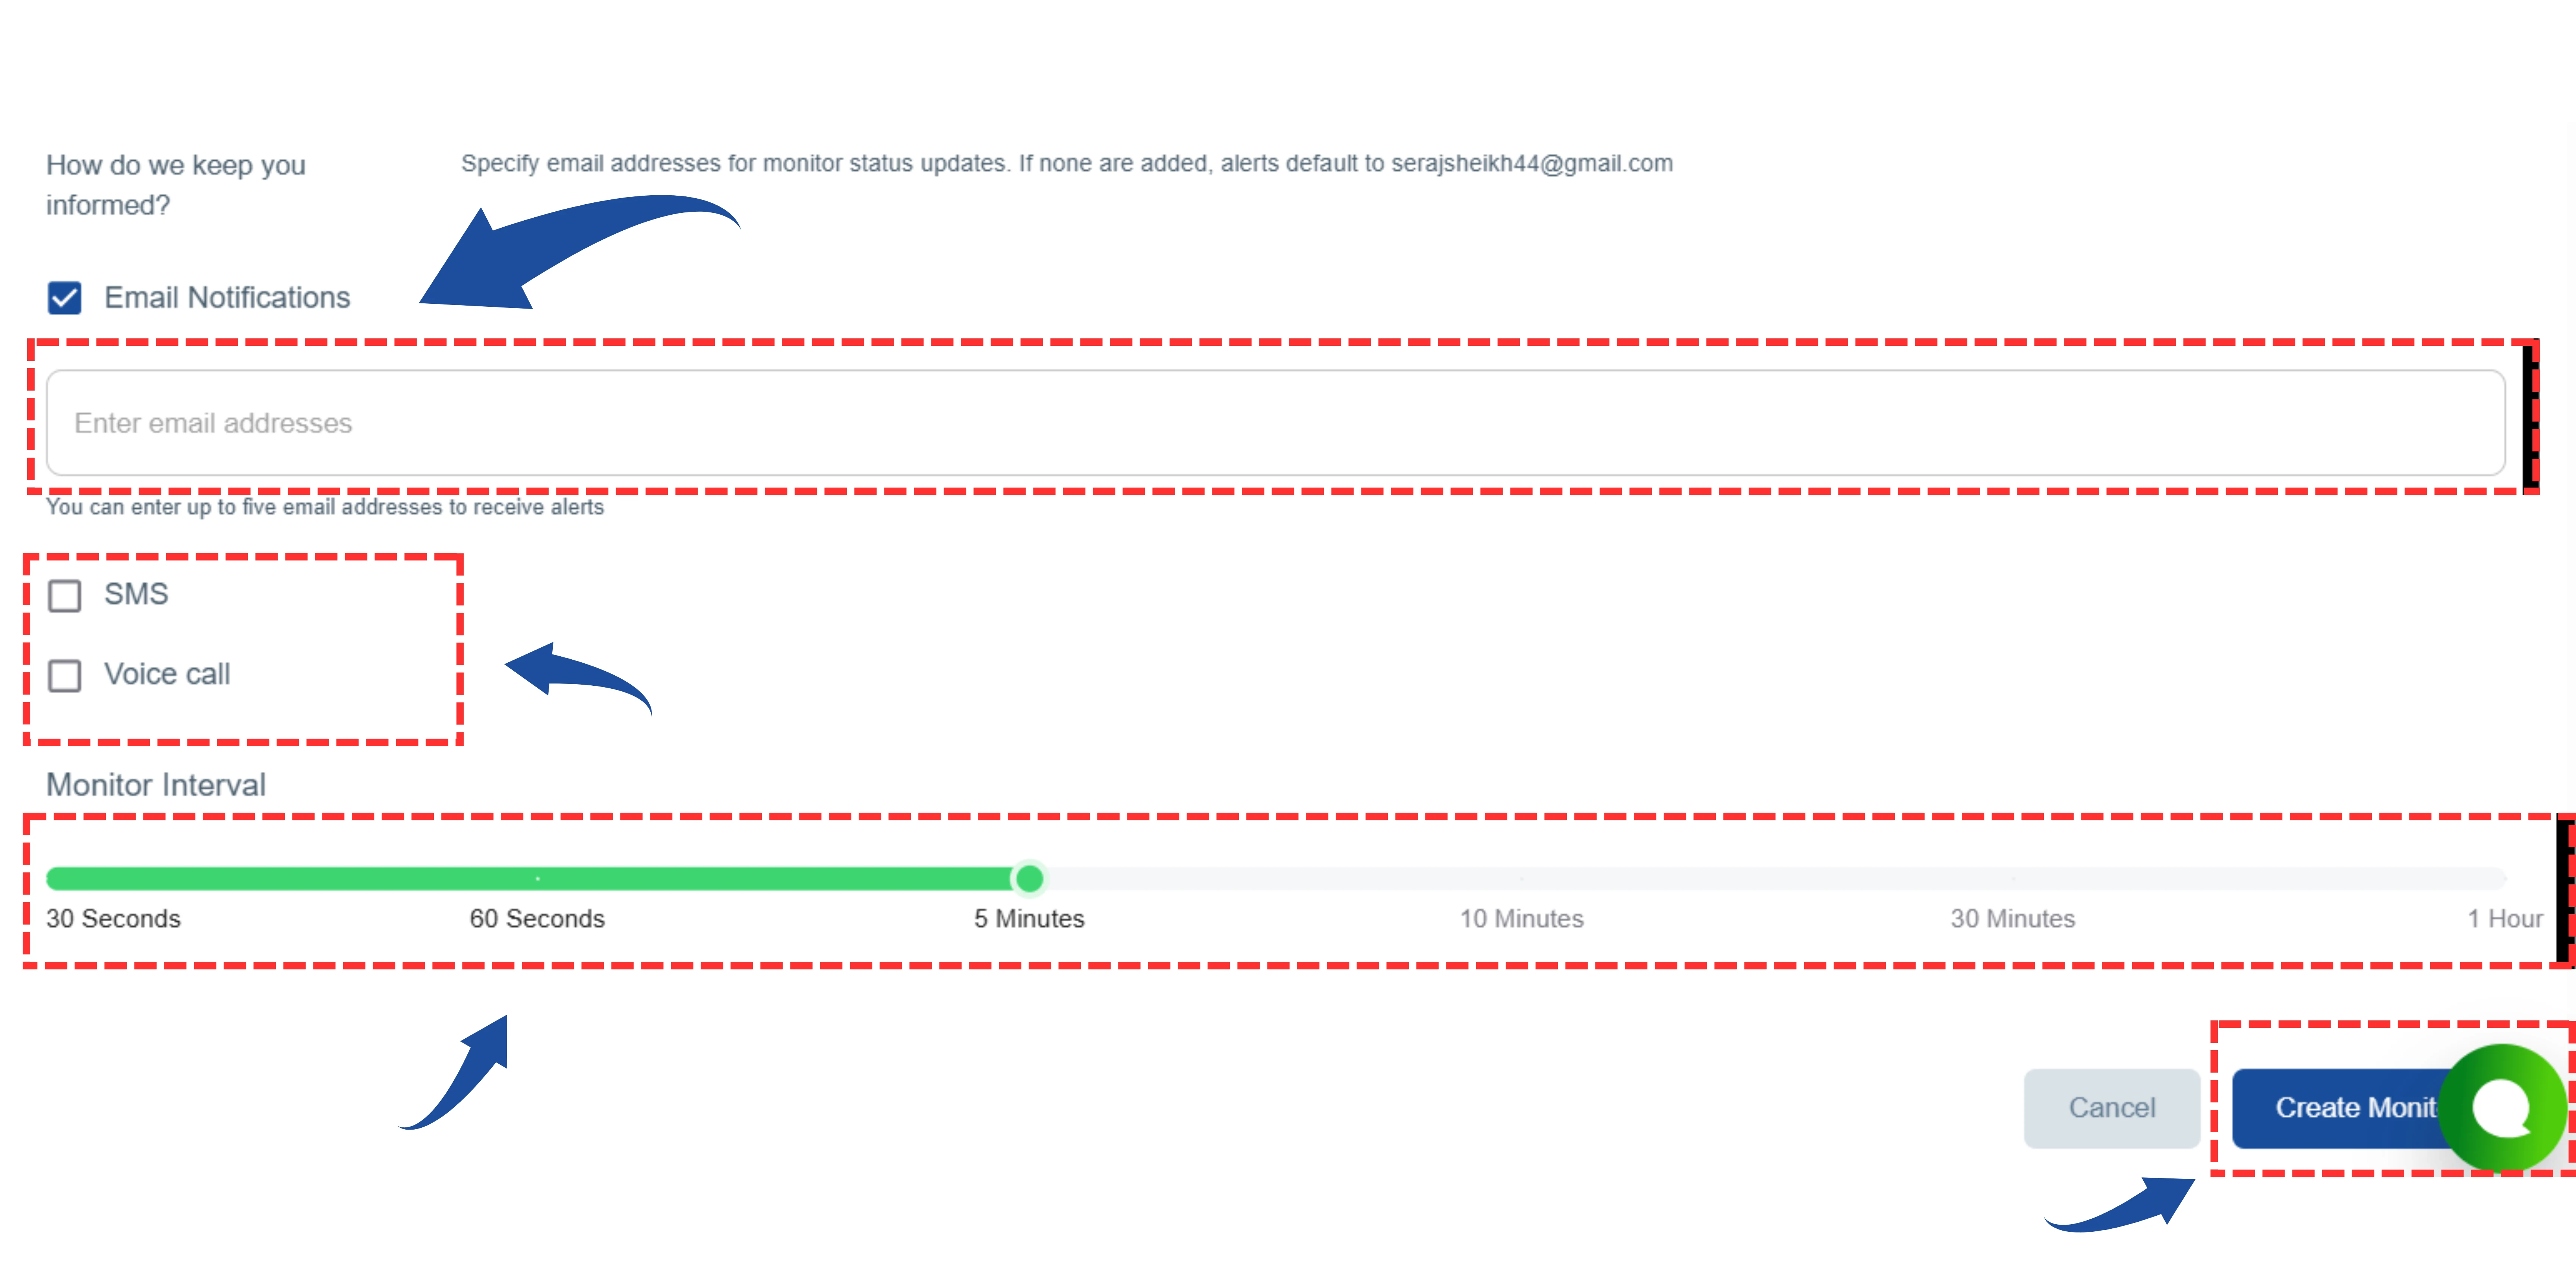
Email Notifications: Enter the specific email addresses where you want to receive alerts.
Alert Types: Choose your preferred methods for receiving immediate alerts:
- SMS
- Voice Call
8 Create The Monitor
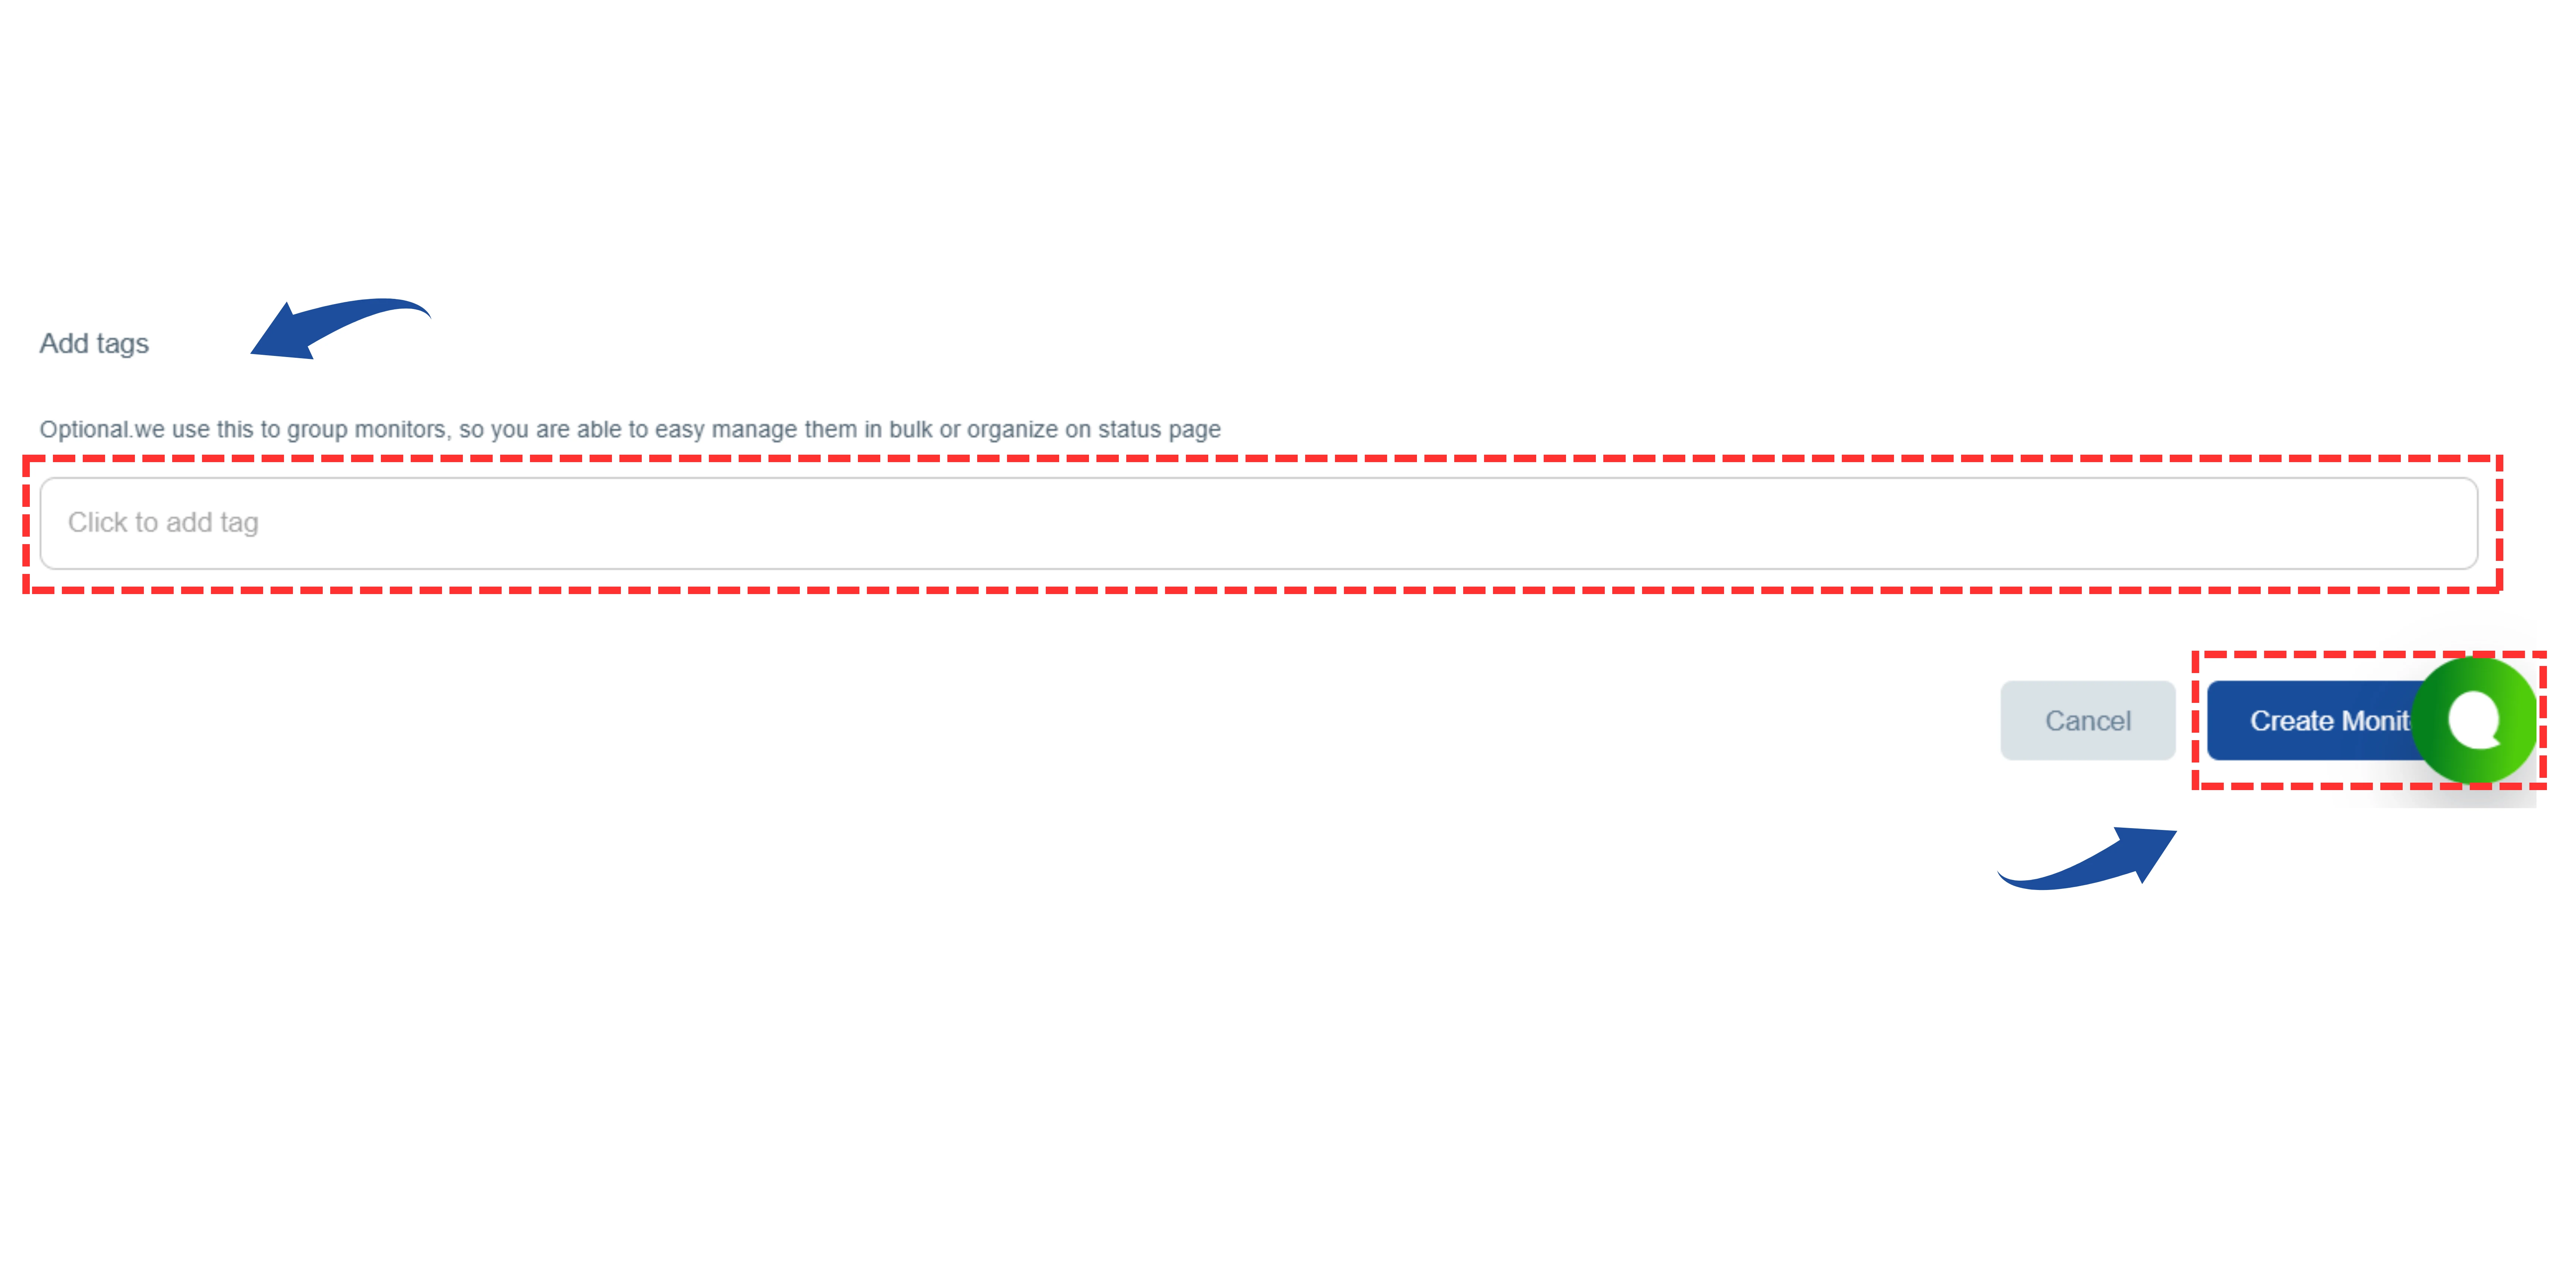
Finally, review all your settings.
Click the "Create Monitor" (or "Next") button to save your configuration and start the monitoring process.