Adding a Port Monitor Dashboard
Learn how to add port monitoring to track services like SMTP and FTP. Our guide shows you how to set up checks, configure alerts, and ensure your TCP services are always available.
1 Go to Your Dashboard
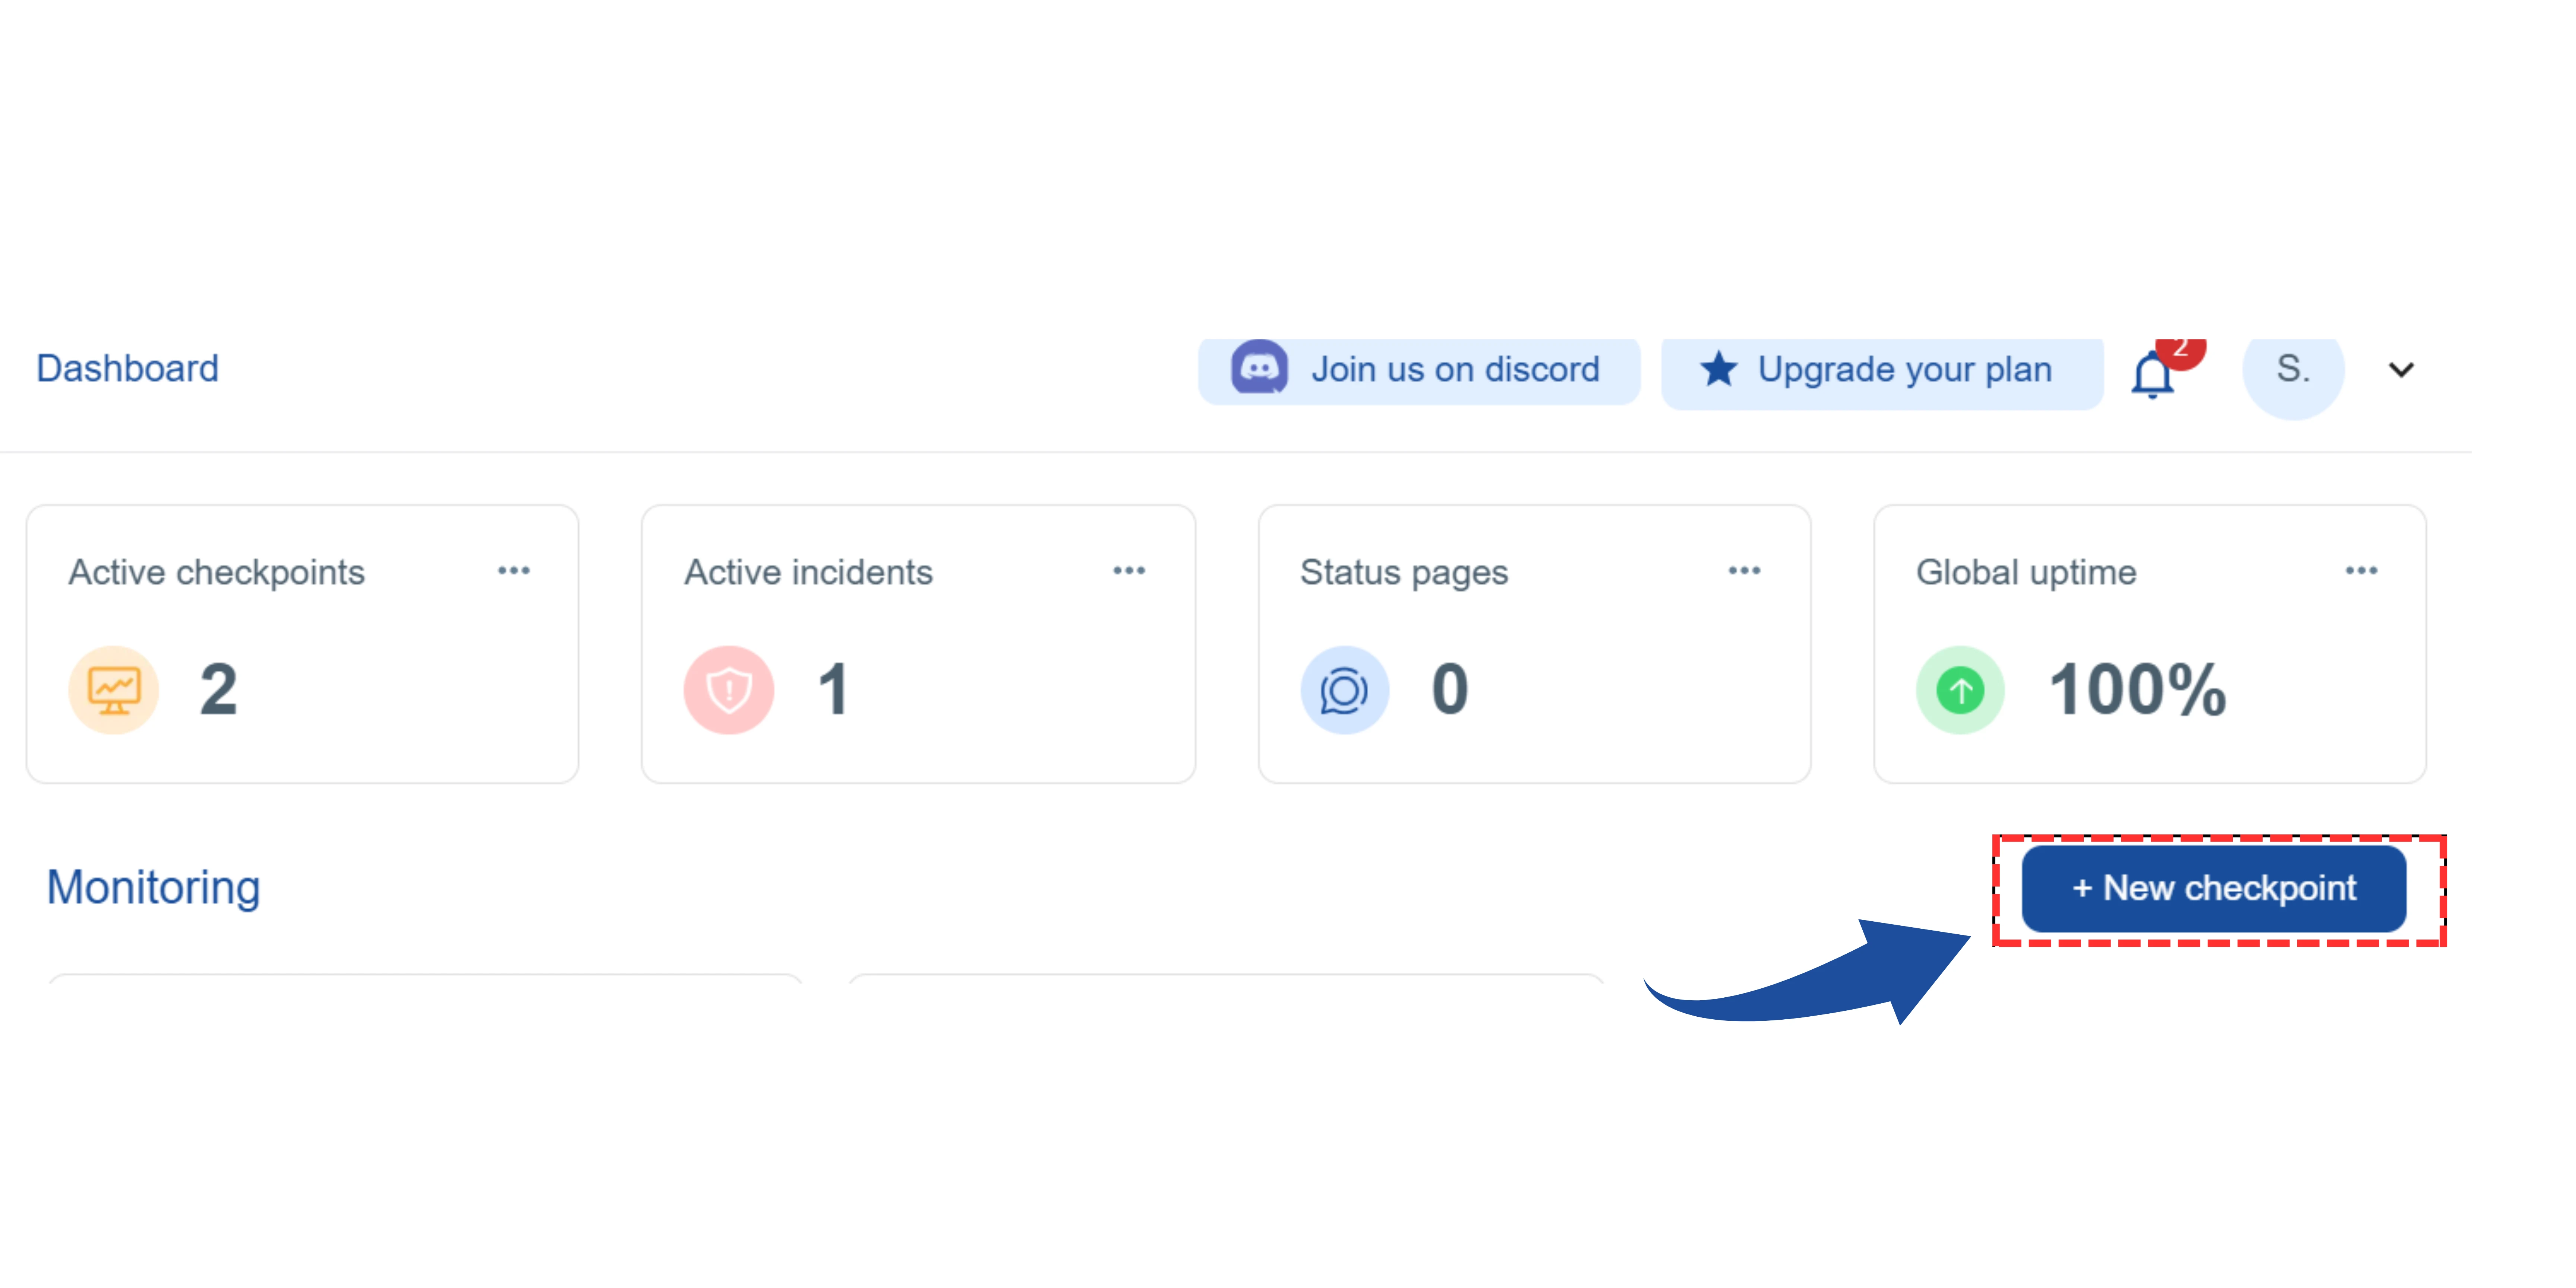
On your main dashboard, you will see the "New Checkpoint" button. Click on it.
2 Select the Checkpoint Type
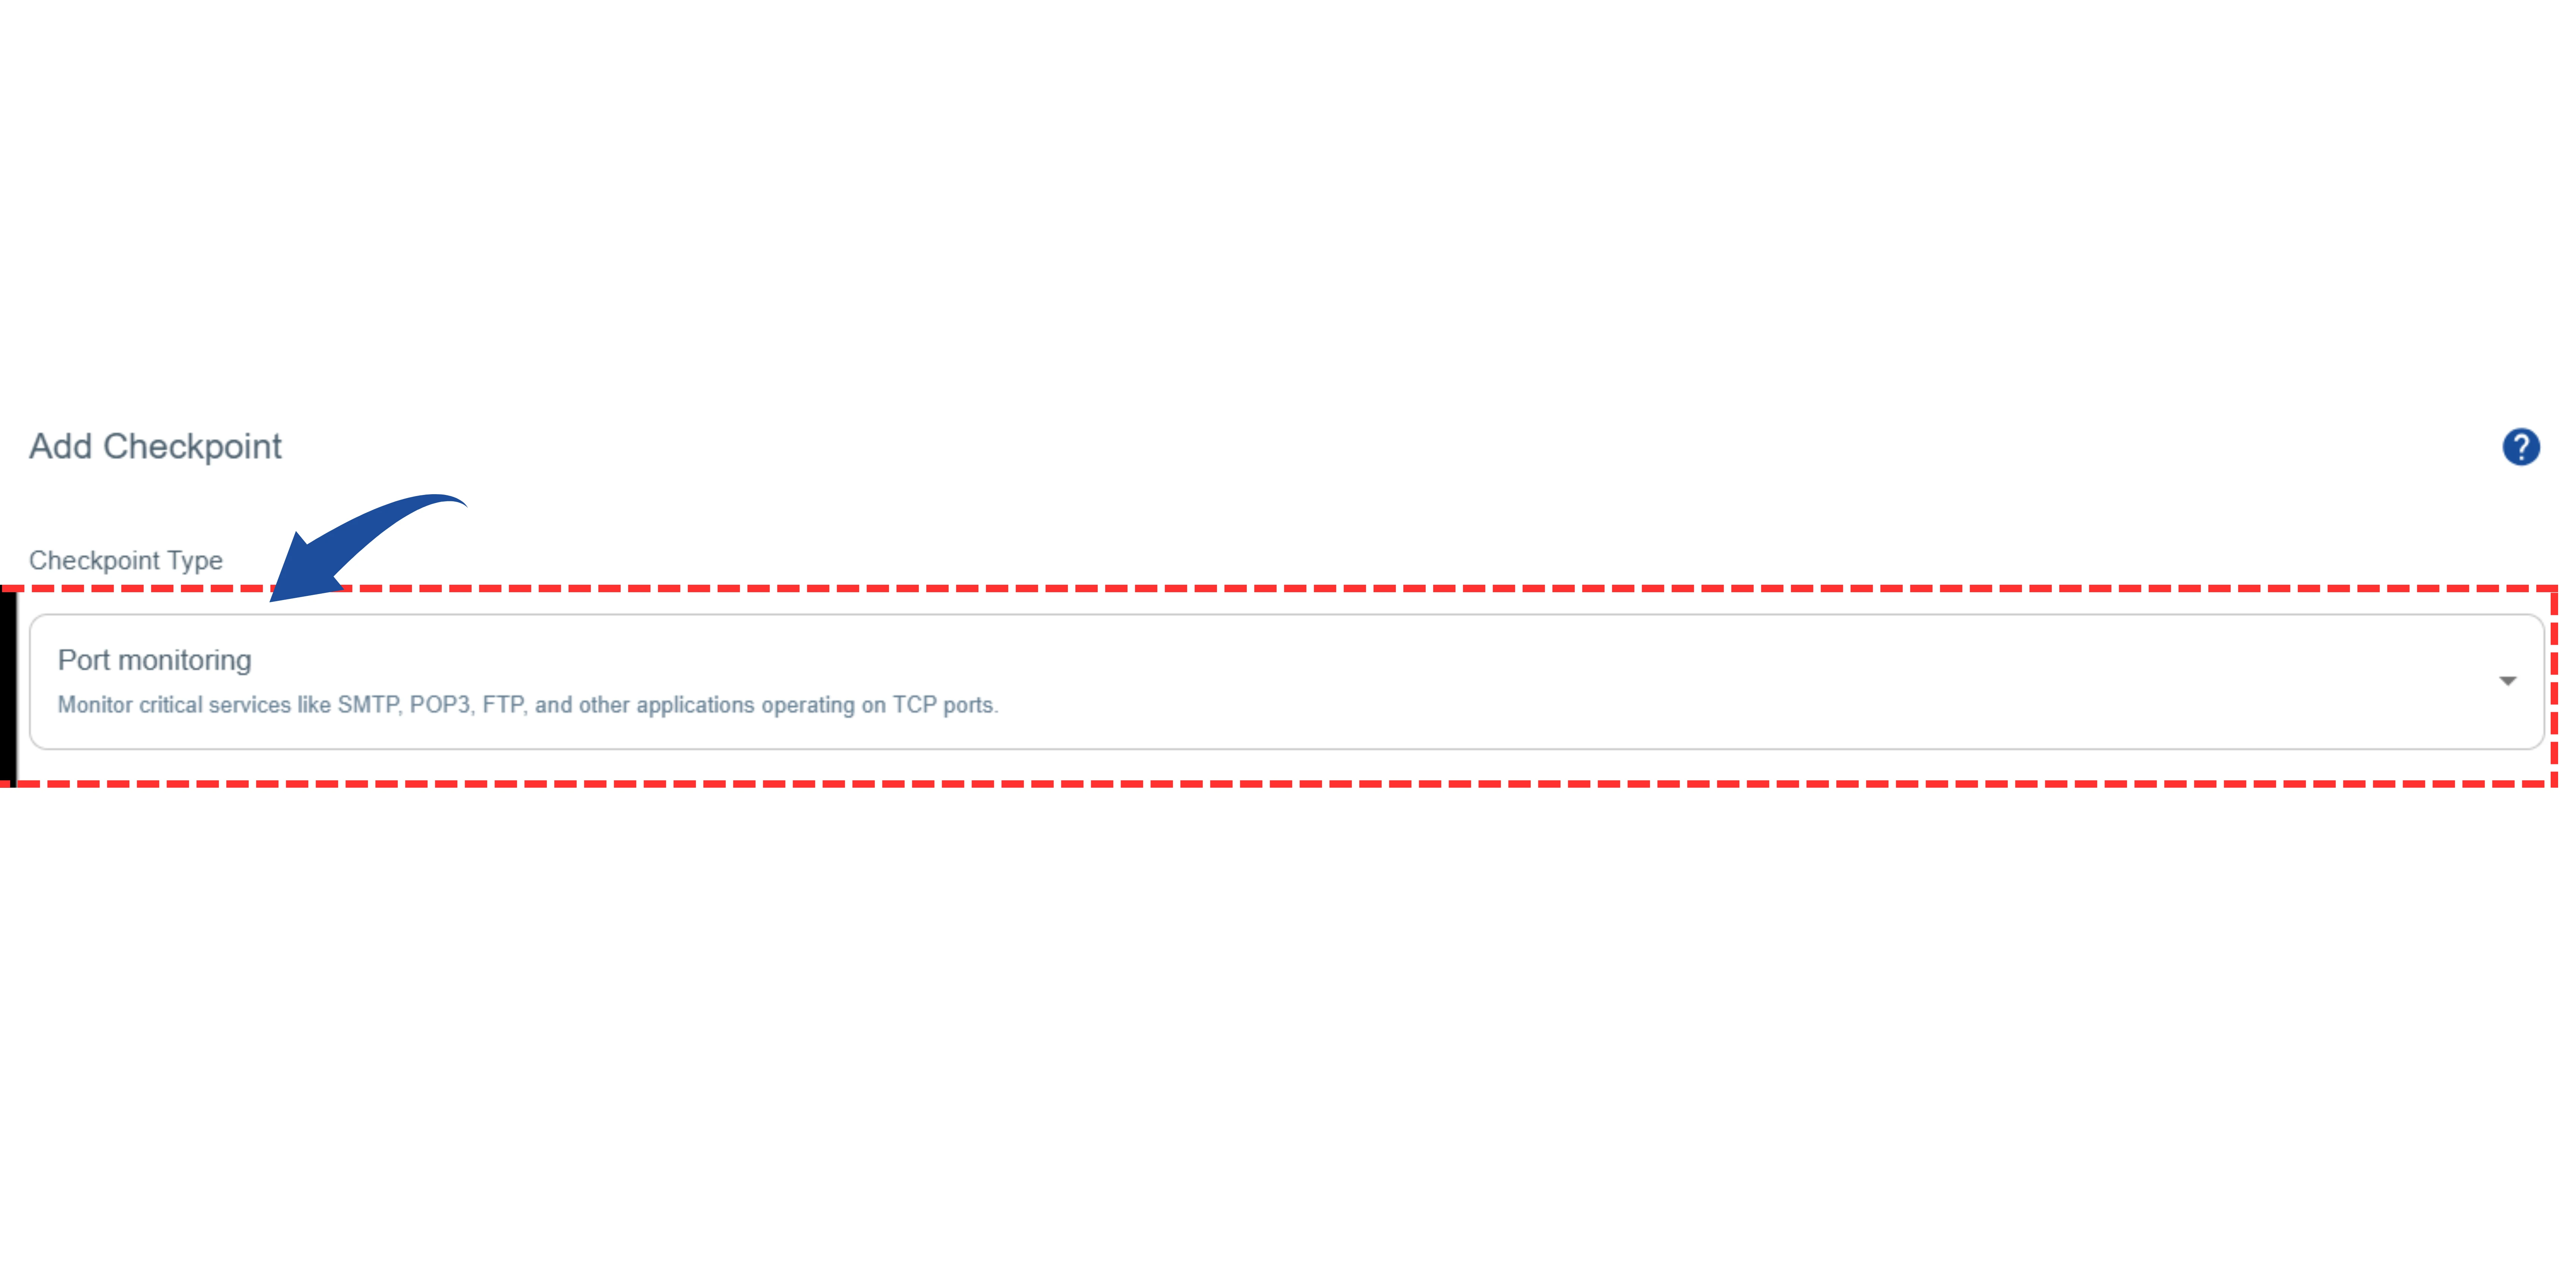
You will be redirected to the"Add Checkpoint" page.
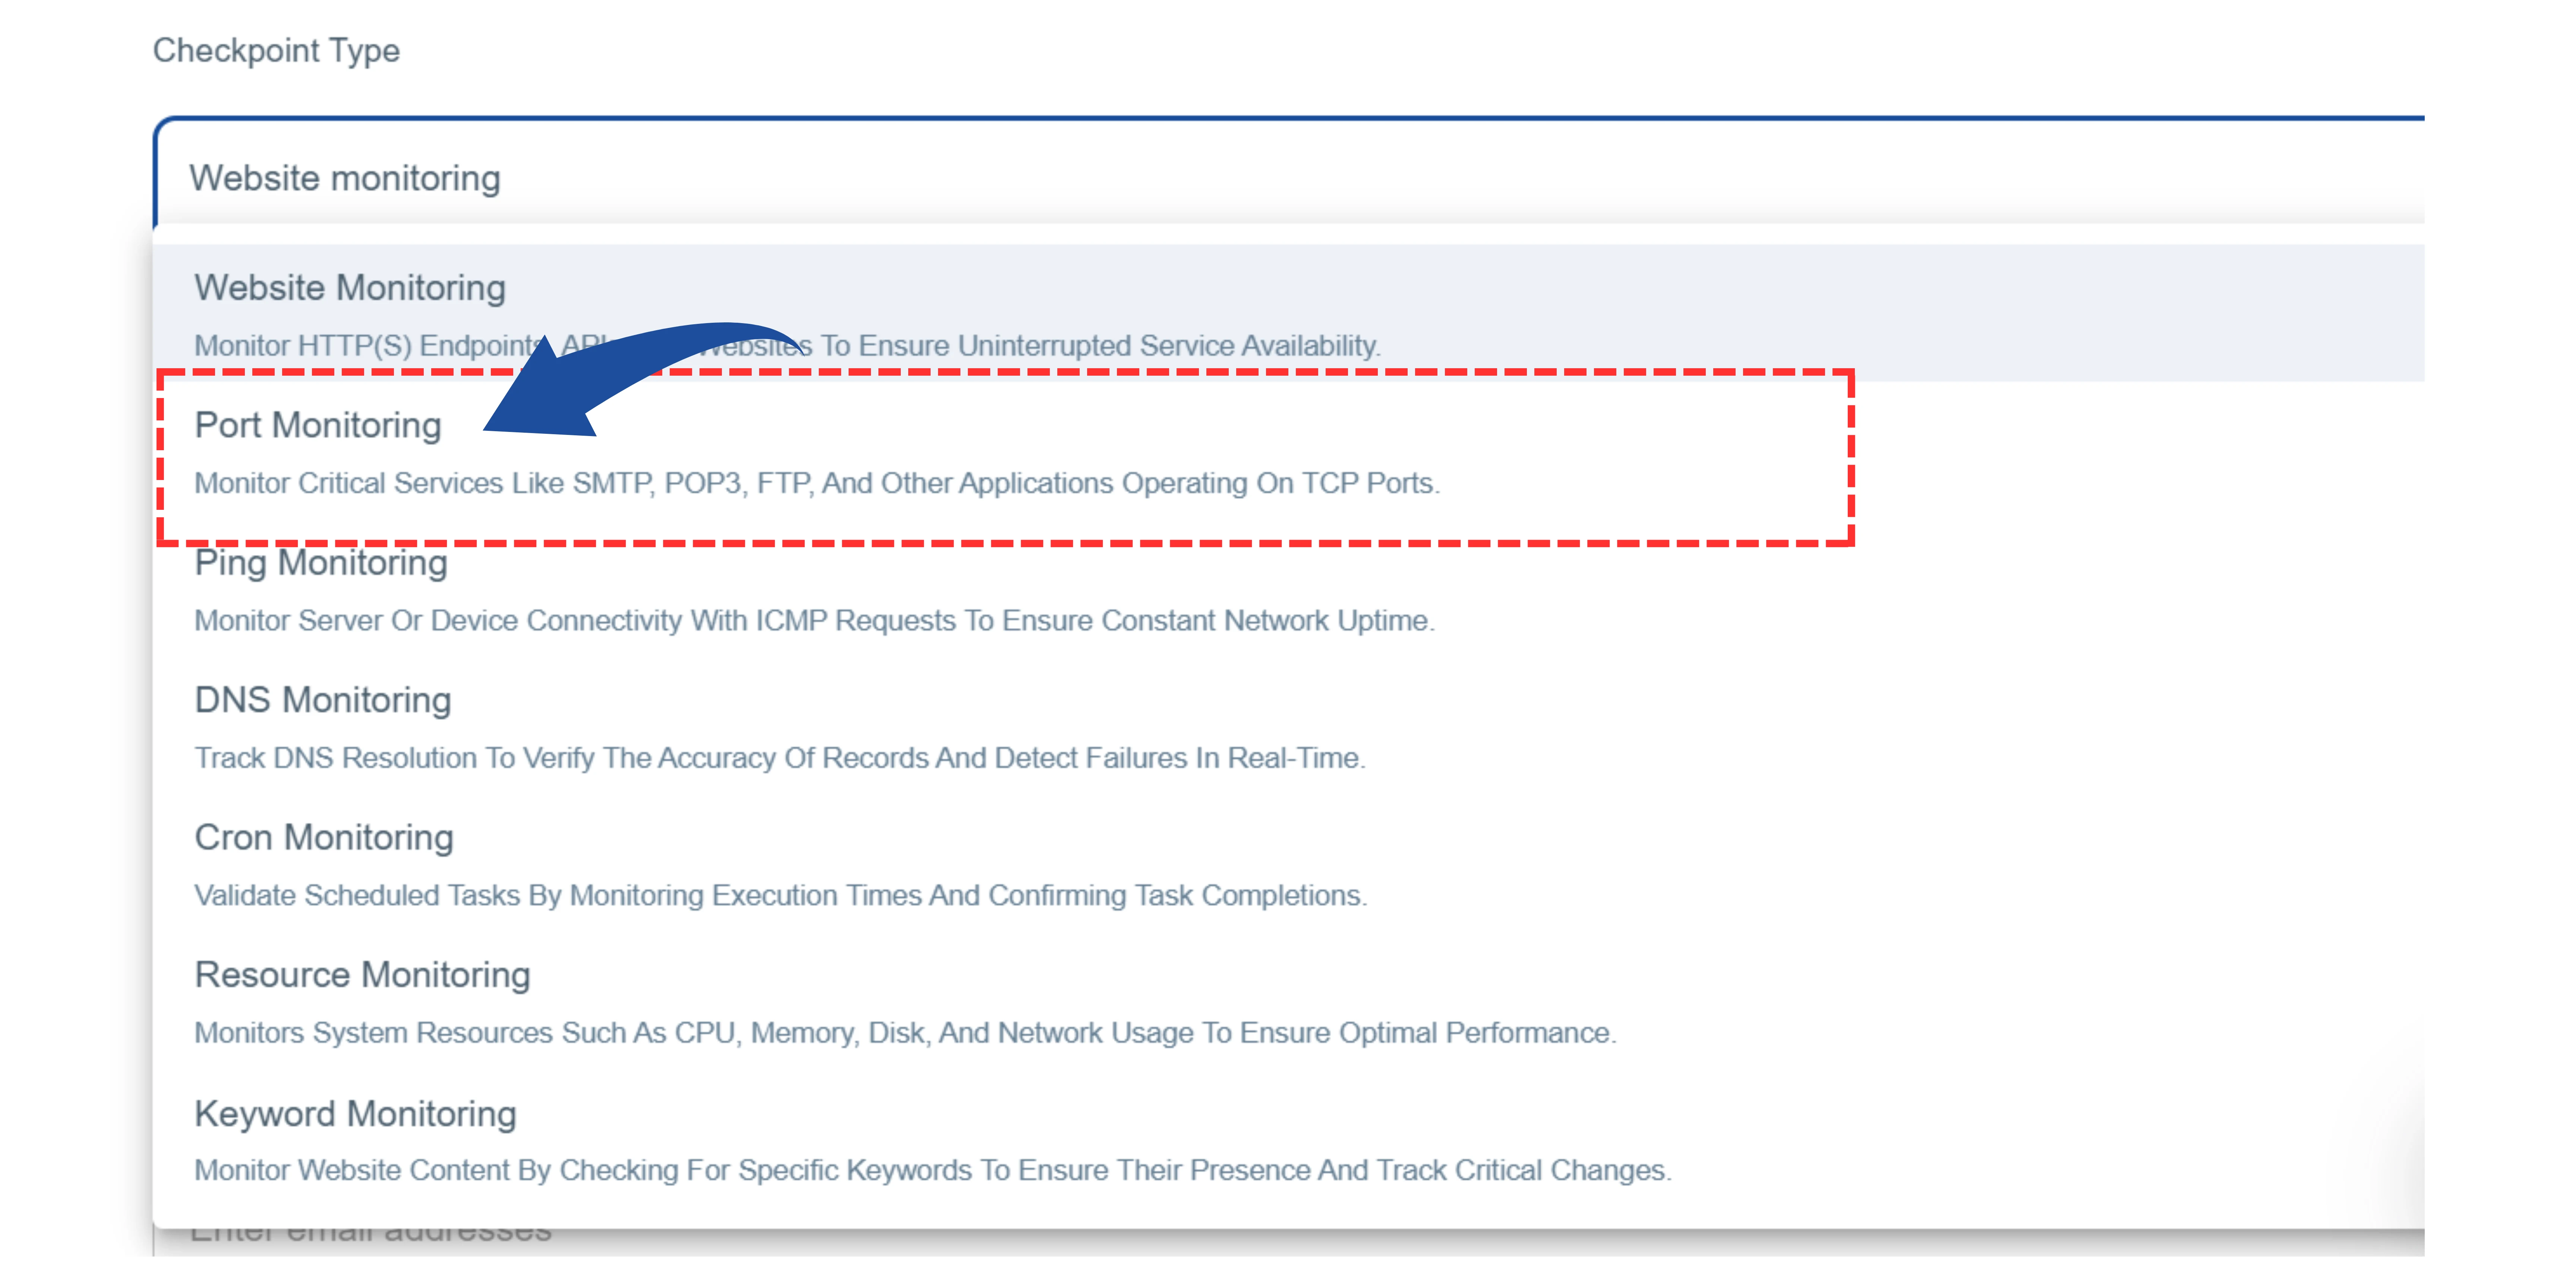
Under"Checkpoint Type" , select "Port Monitoring".
3 Enter Port Details
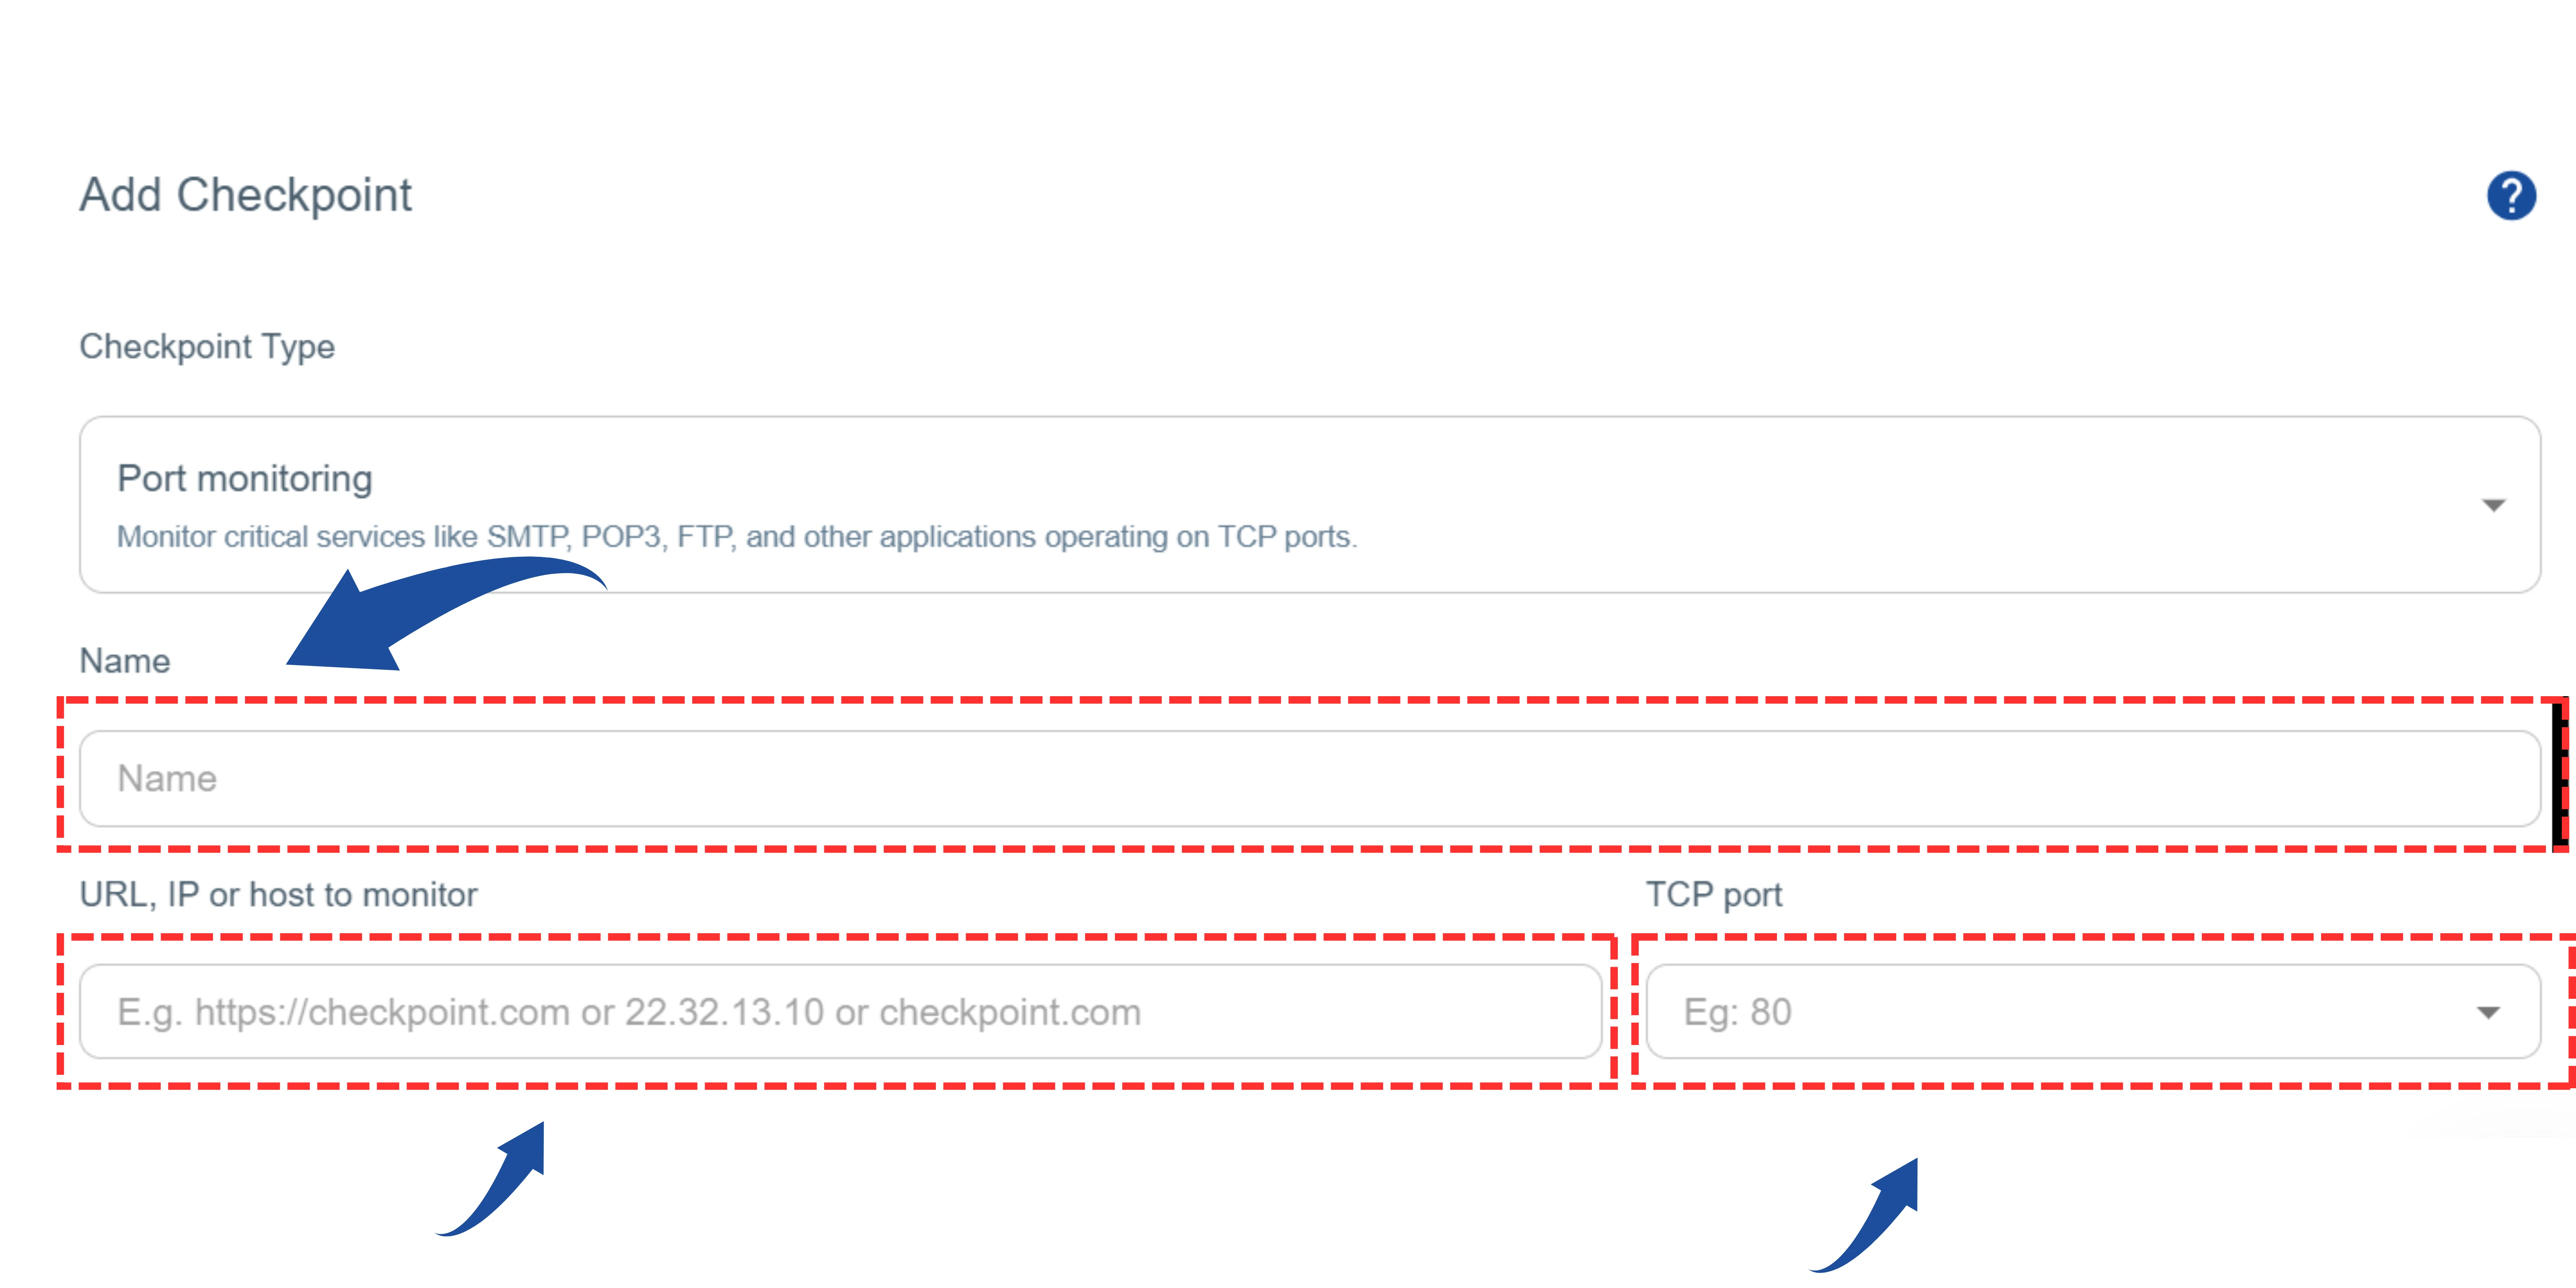
Name: Give a unique name for the service you are monitoring, for example “Main SMTP Server”.
URL, IP or Host: Enter the server’s domain or IP address without http:// or https:// (e.g., 192.168.1.1).
TCP Port: Specify the port number to be monitored (e.g., 25 for SMTP, 21 for FTP).
4 Configure Monitoring Settings
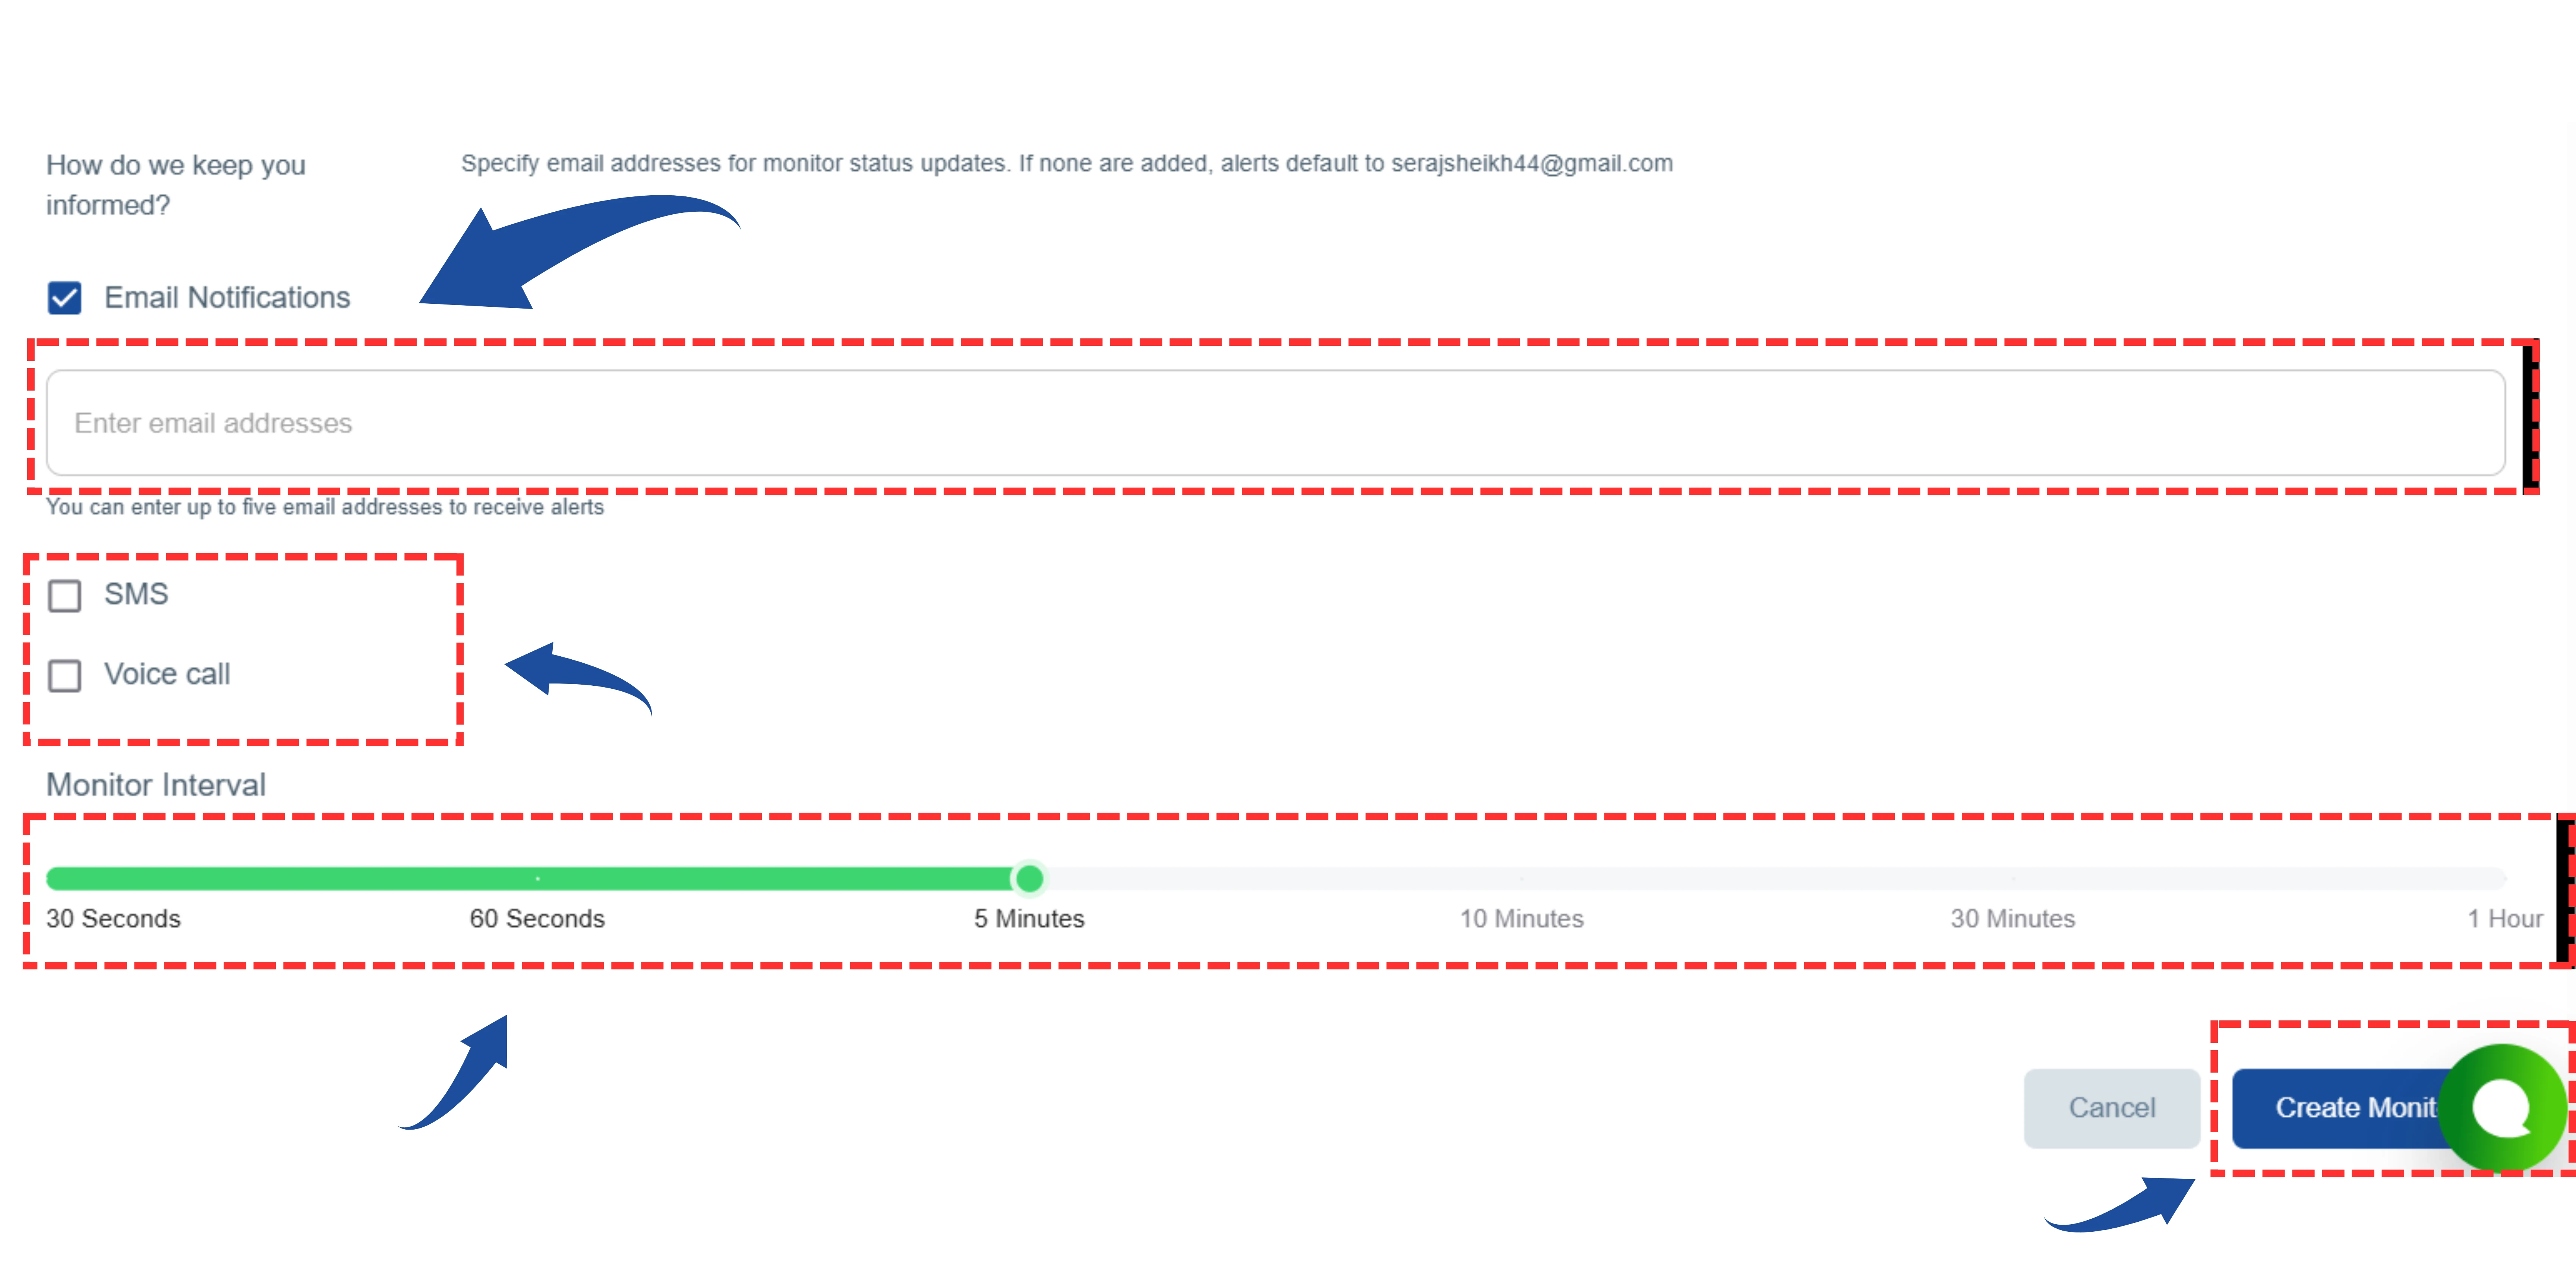
- Email Notifications: Place your email address for notification
- Ping Interval: Choose how often you want the port to be checked. If not selected, the system will use the default interval.
- Alert Types: Choose how to receive alerts: SMS , Voice Call
- Location: Select at least one monitoring location from the available options.
5 Create the Monitor
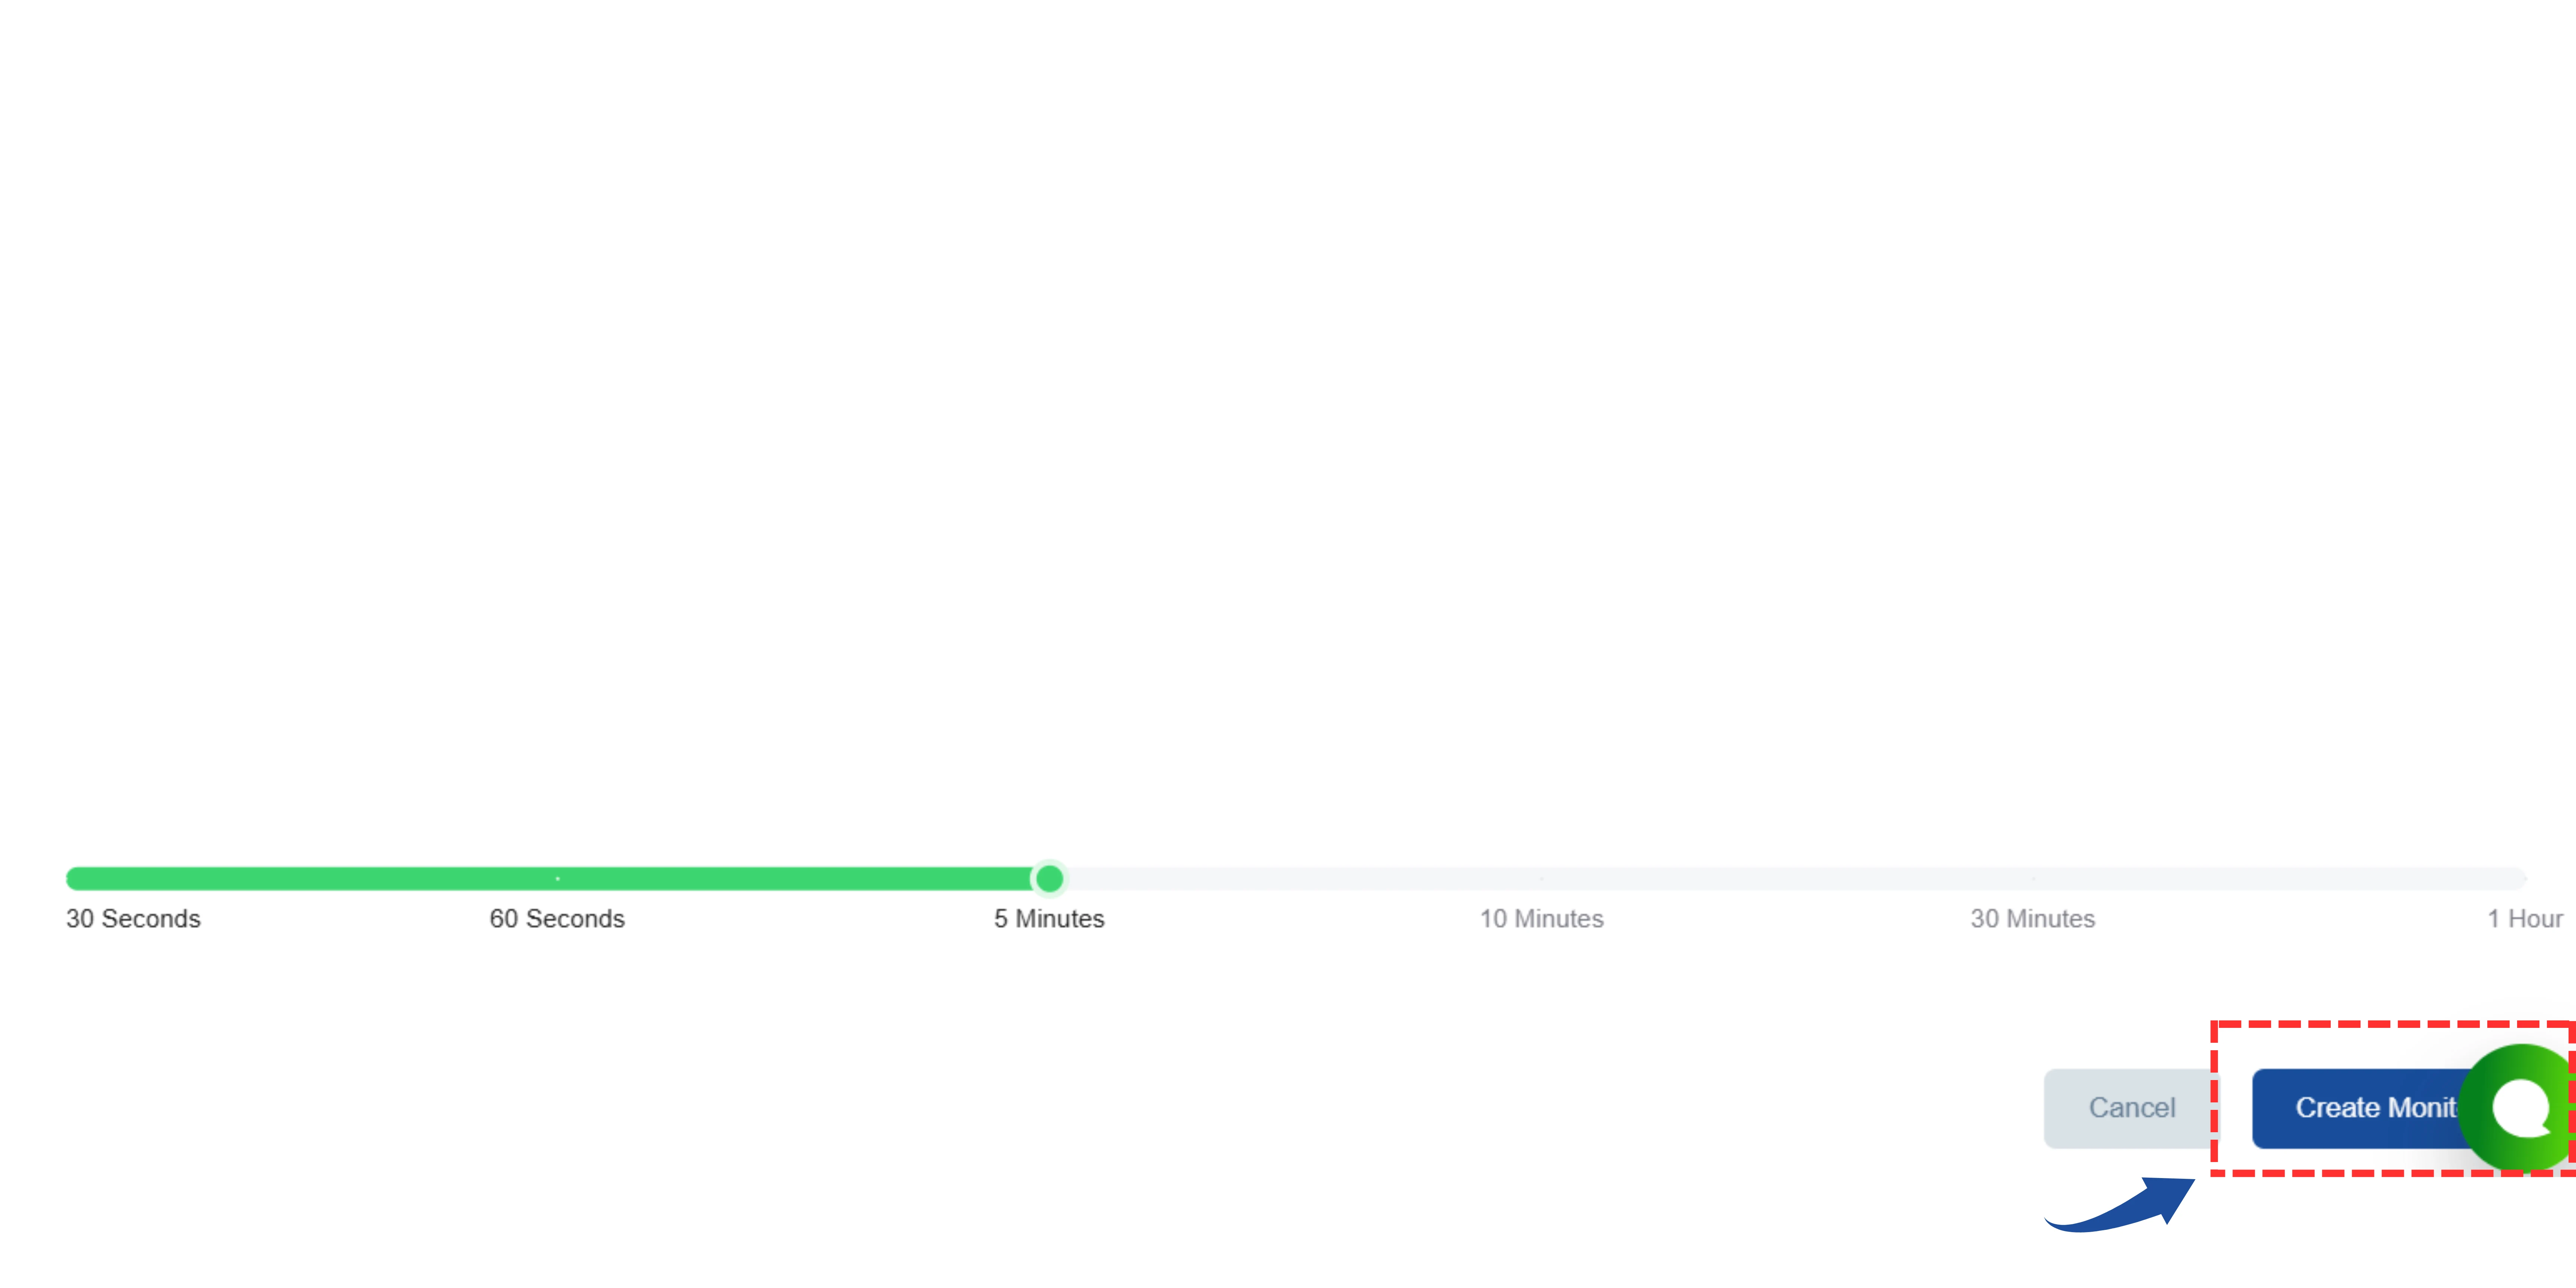
Click the “Create Monitor” button to save and activate the port monitor.
If the port is down during setup, a “Server is not up” warning will appear.
Review and correct the details, or
Bypass the warning by selecting “Skip Test Connection”.