Adding a Cron job to Your Monitoring Dashboard
Our guide explains how to monitor scheduled tasks and cron jobs. Learn to set expected schedules and receive alerts if your automated jobs fail to run on time.
1 Go to Your Dashboard
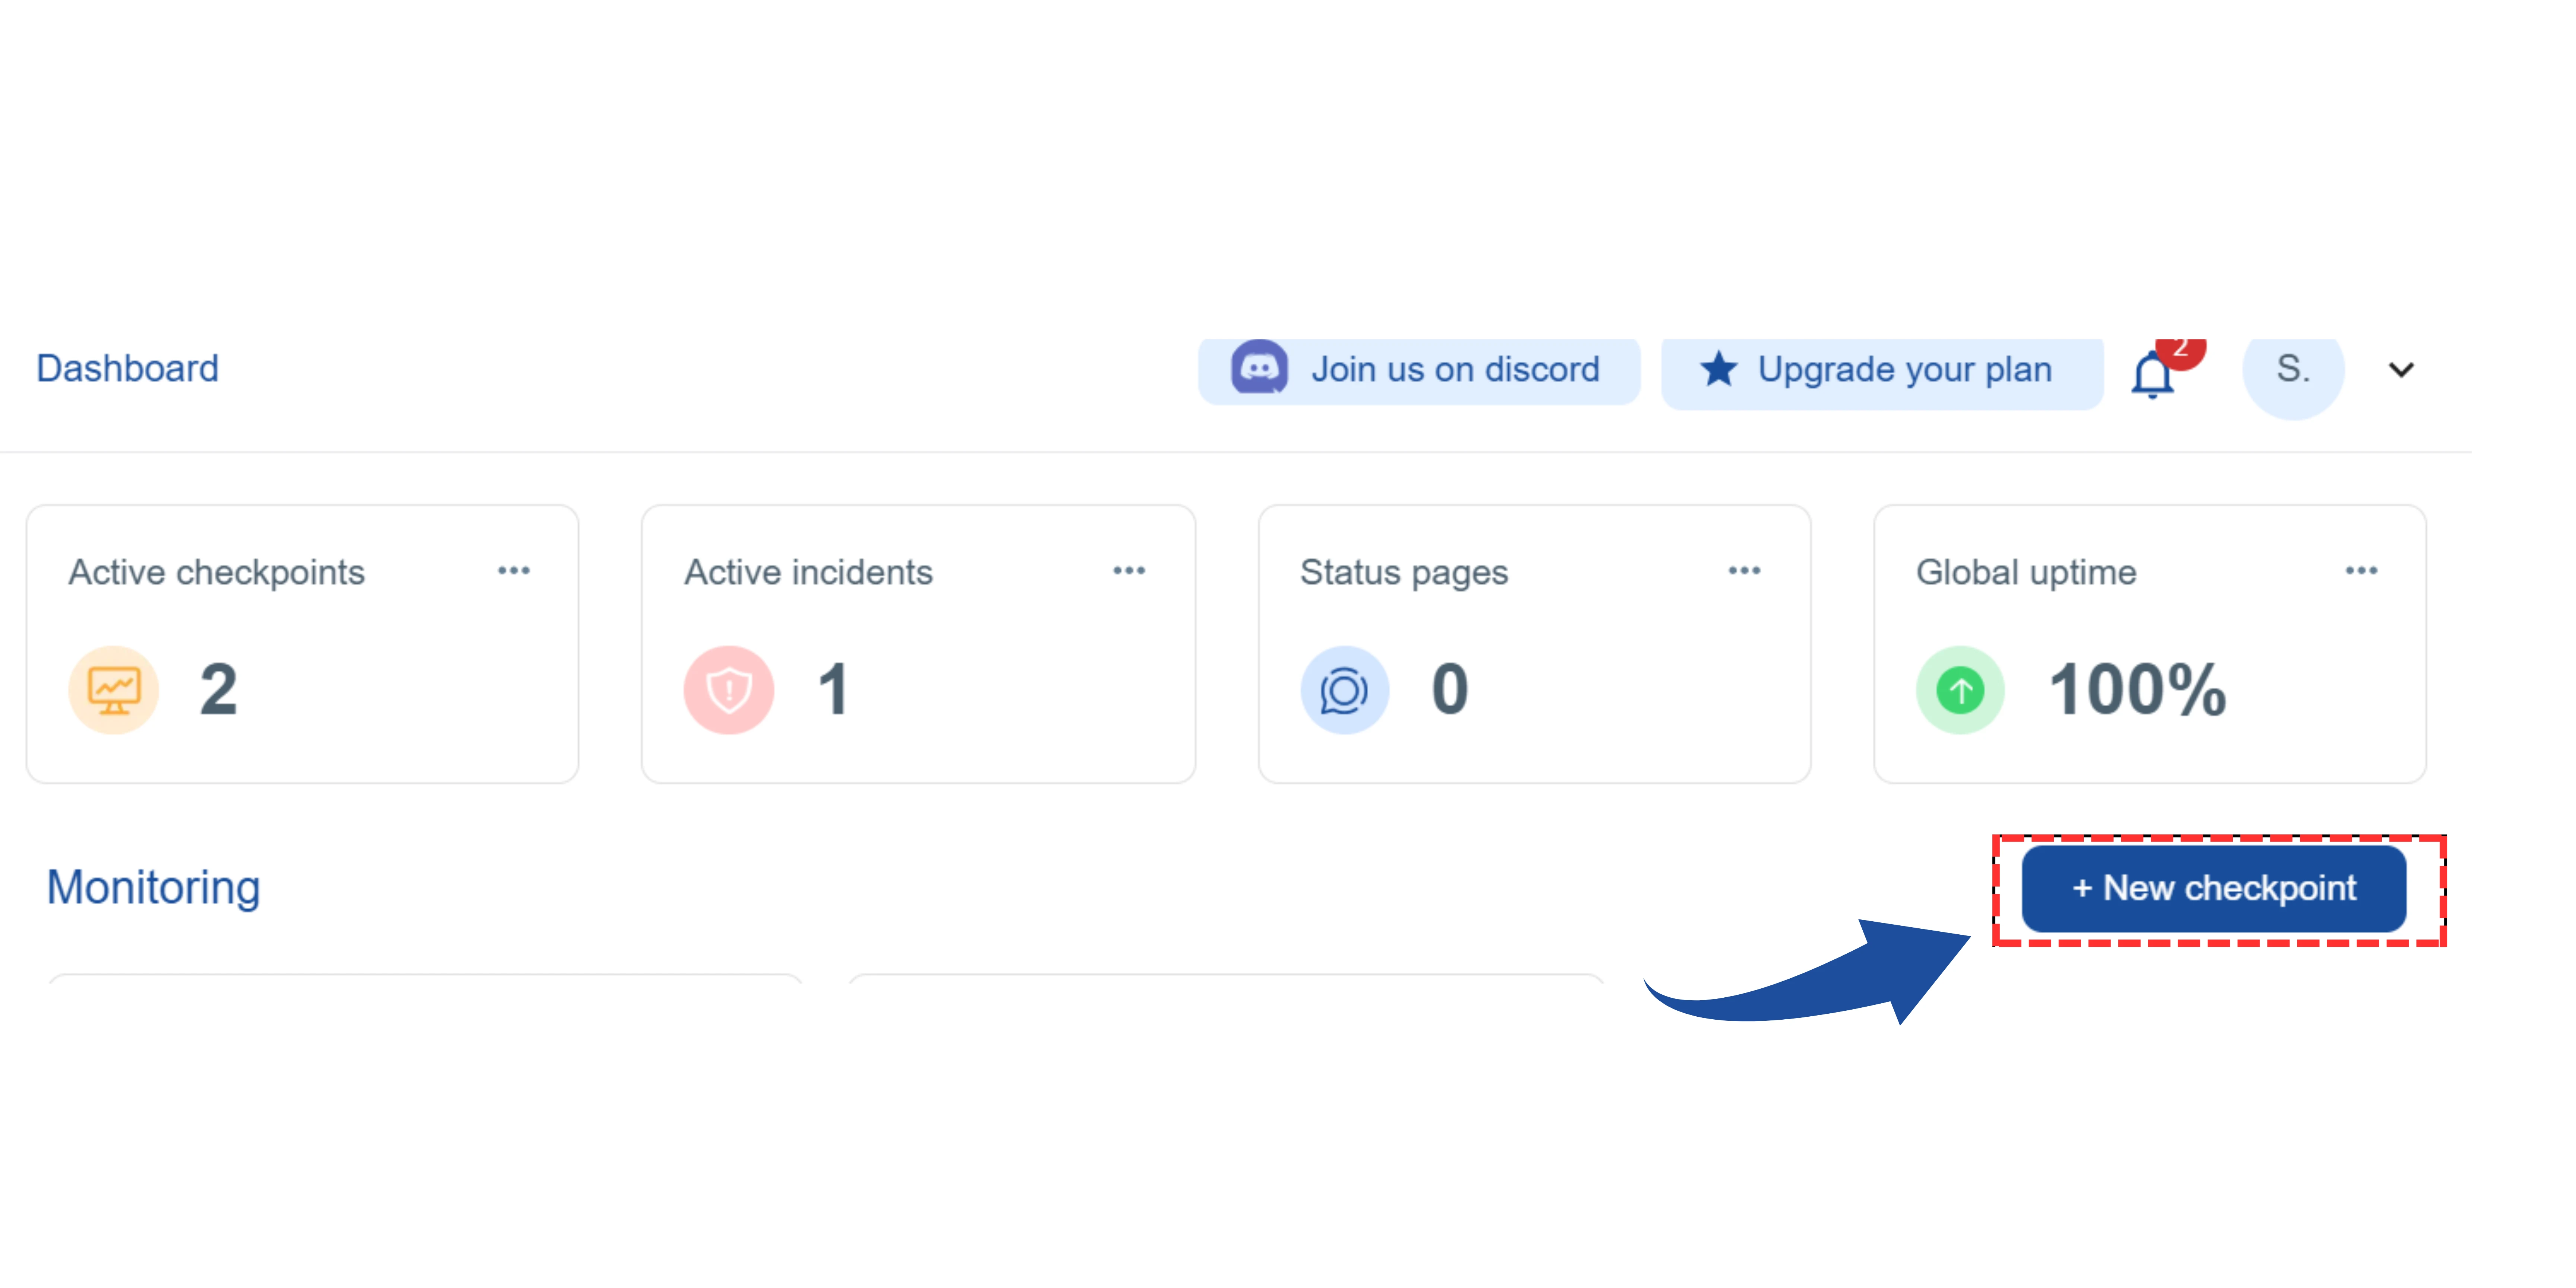
On your main dashboard, you will see the "New Checkpoint" button. Click on it.
2 Select the Checkpoint Type
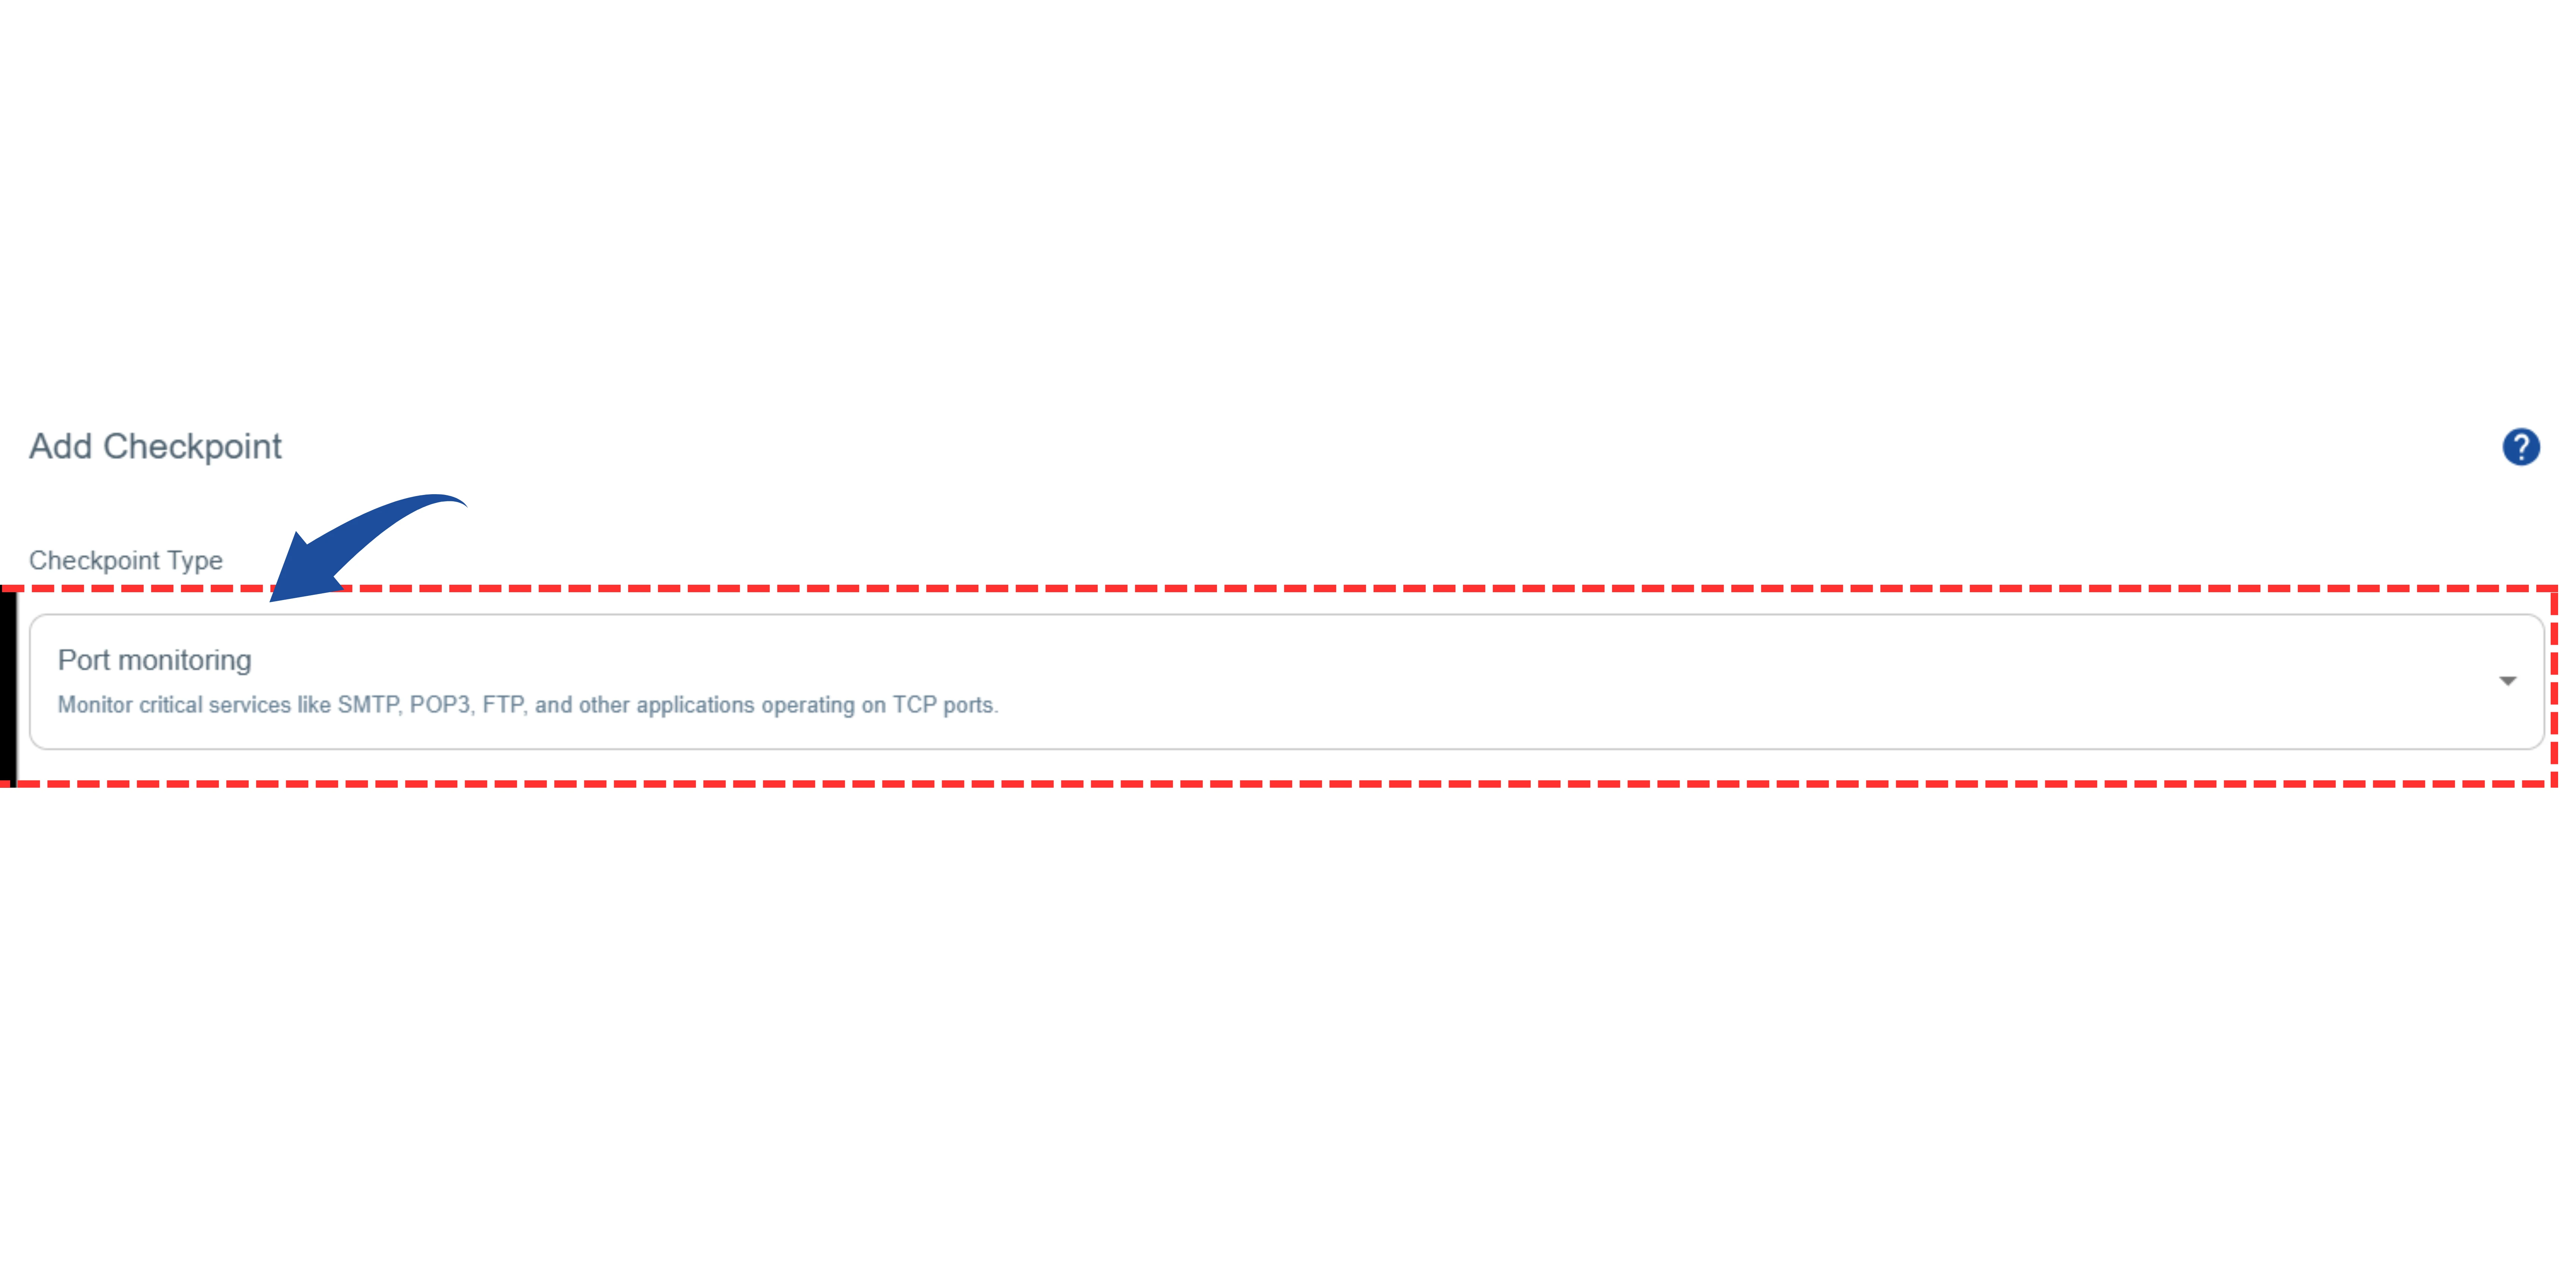
You will be redirected to the"Add Checkpoint" page.
Look for the "Checkpoint Type" option.
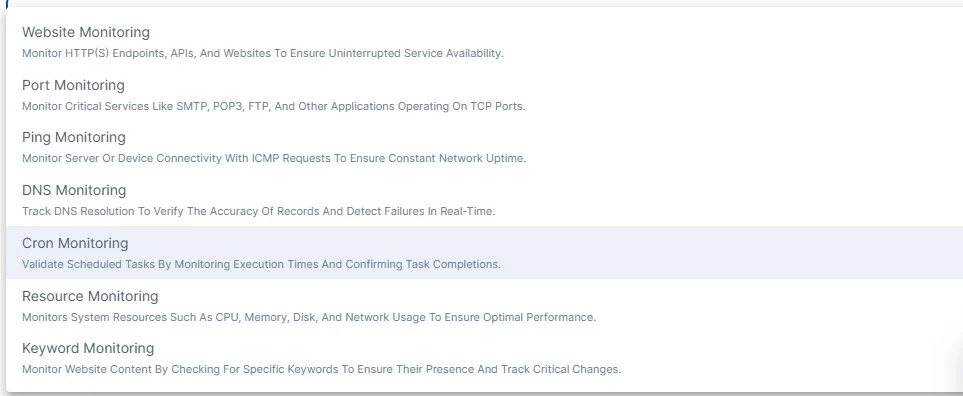
From the list, select "Cron job Monitoring".
3 Name Your Monitor
Give your monitor a descriptive name.
Example: "Daily Data Sync" or "Production API Health Check".

4 Configure the Schedule and Timeout
This step defines when the tool should expect to receive a signal from your service and how long to wait for it. For Example (Cron job Monitoring):
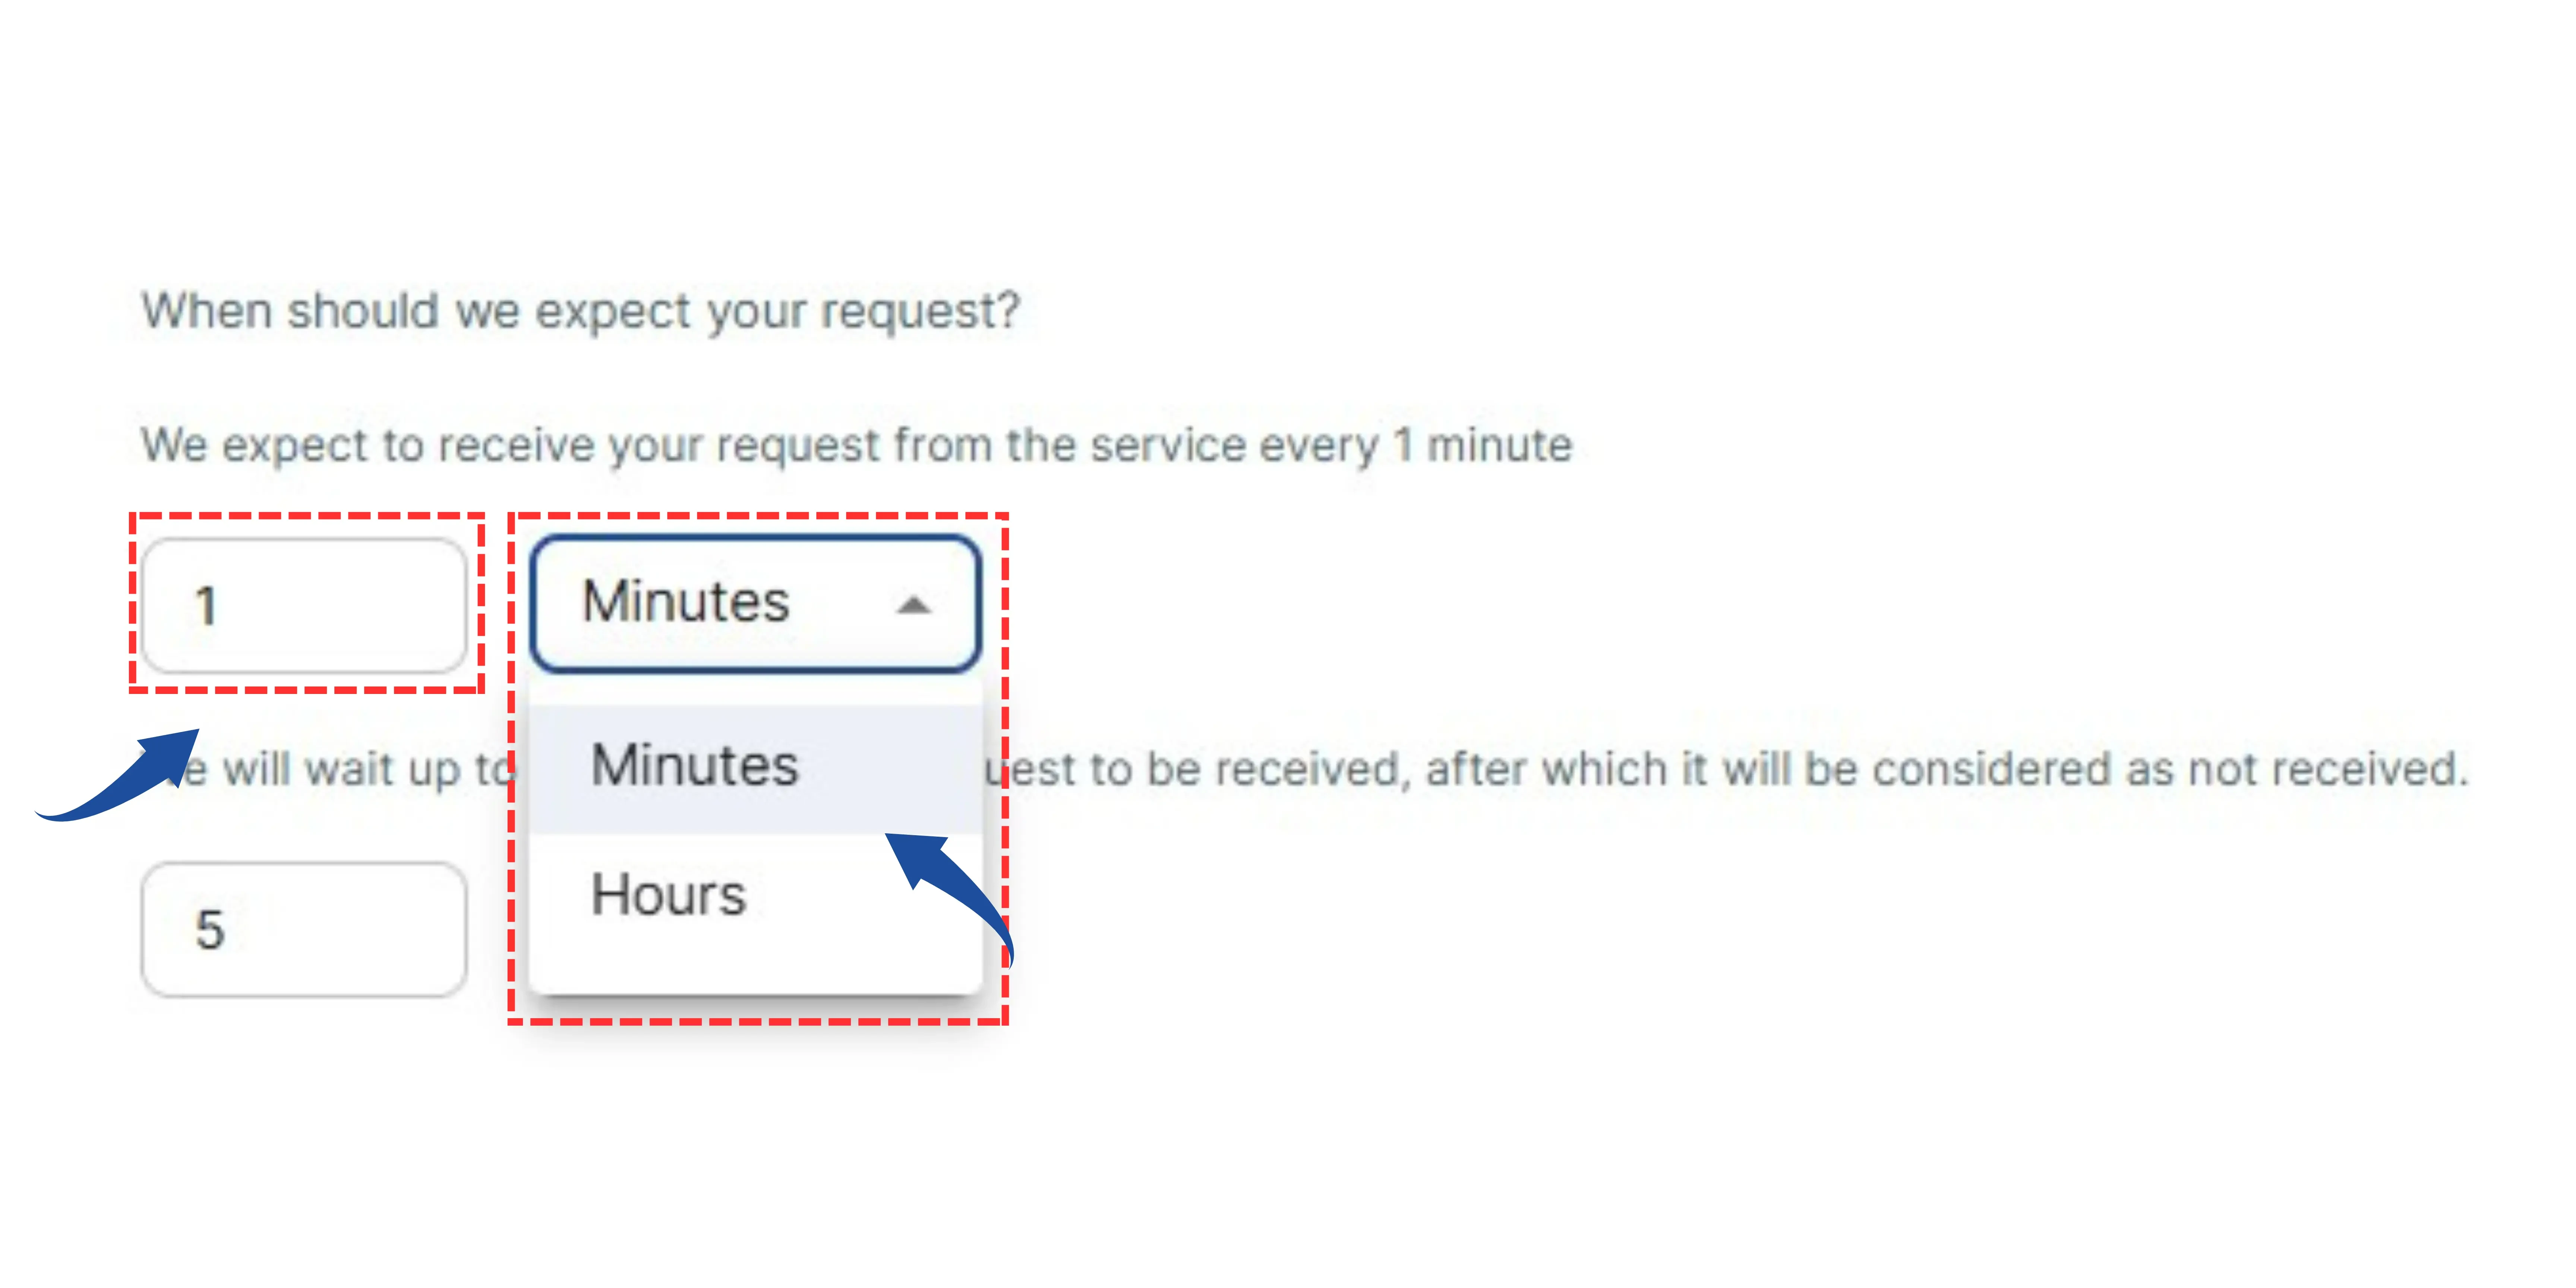
- "When should we expect your request?": Set this to how often the task runs (e.g., every 1 Minute).
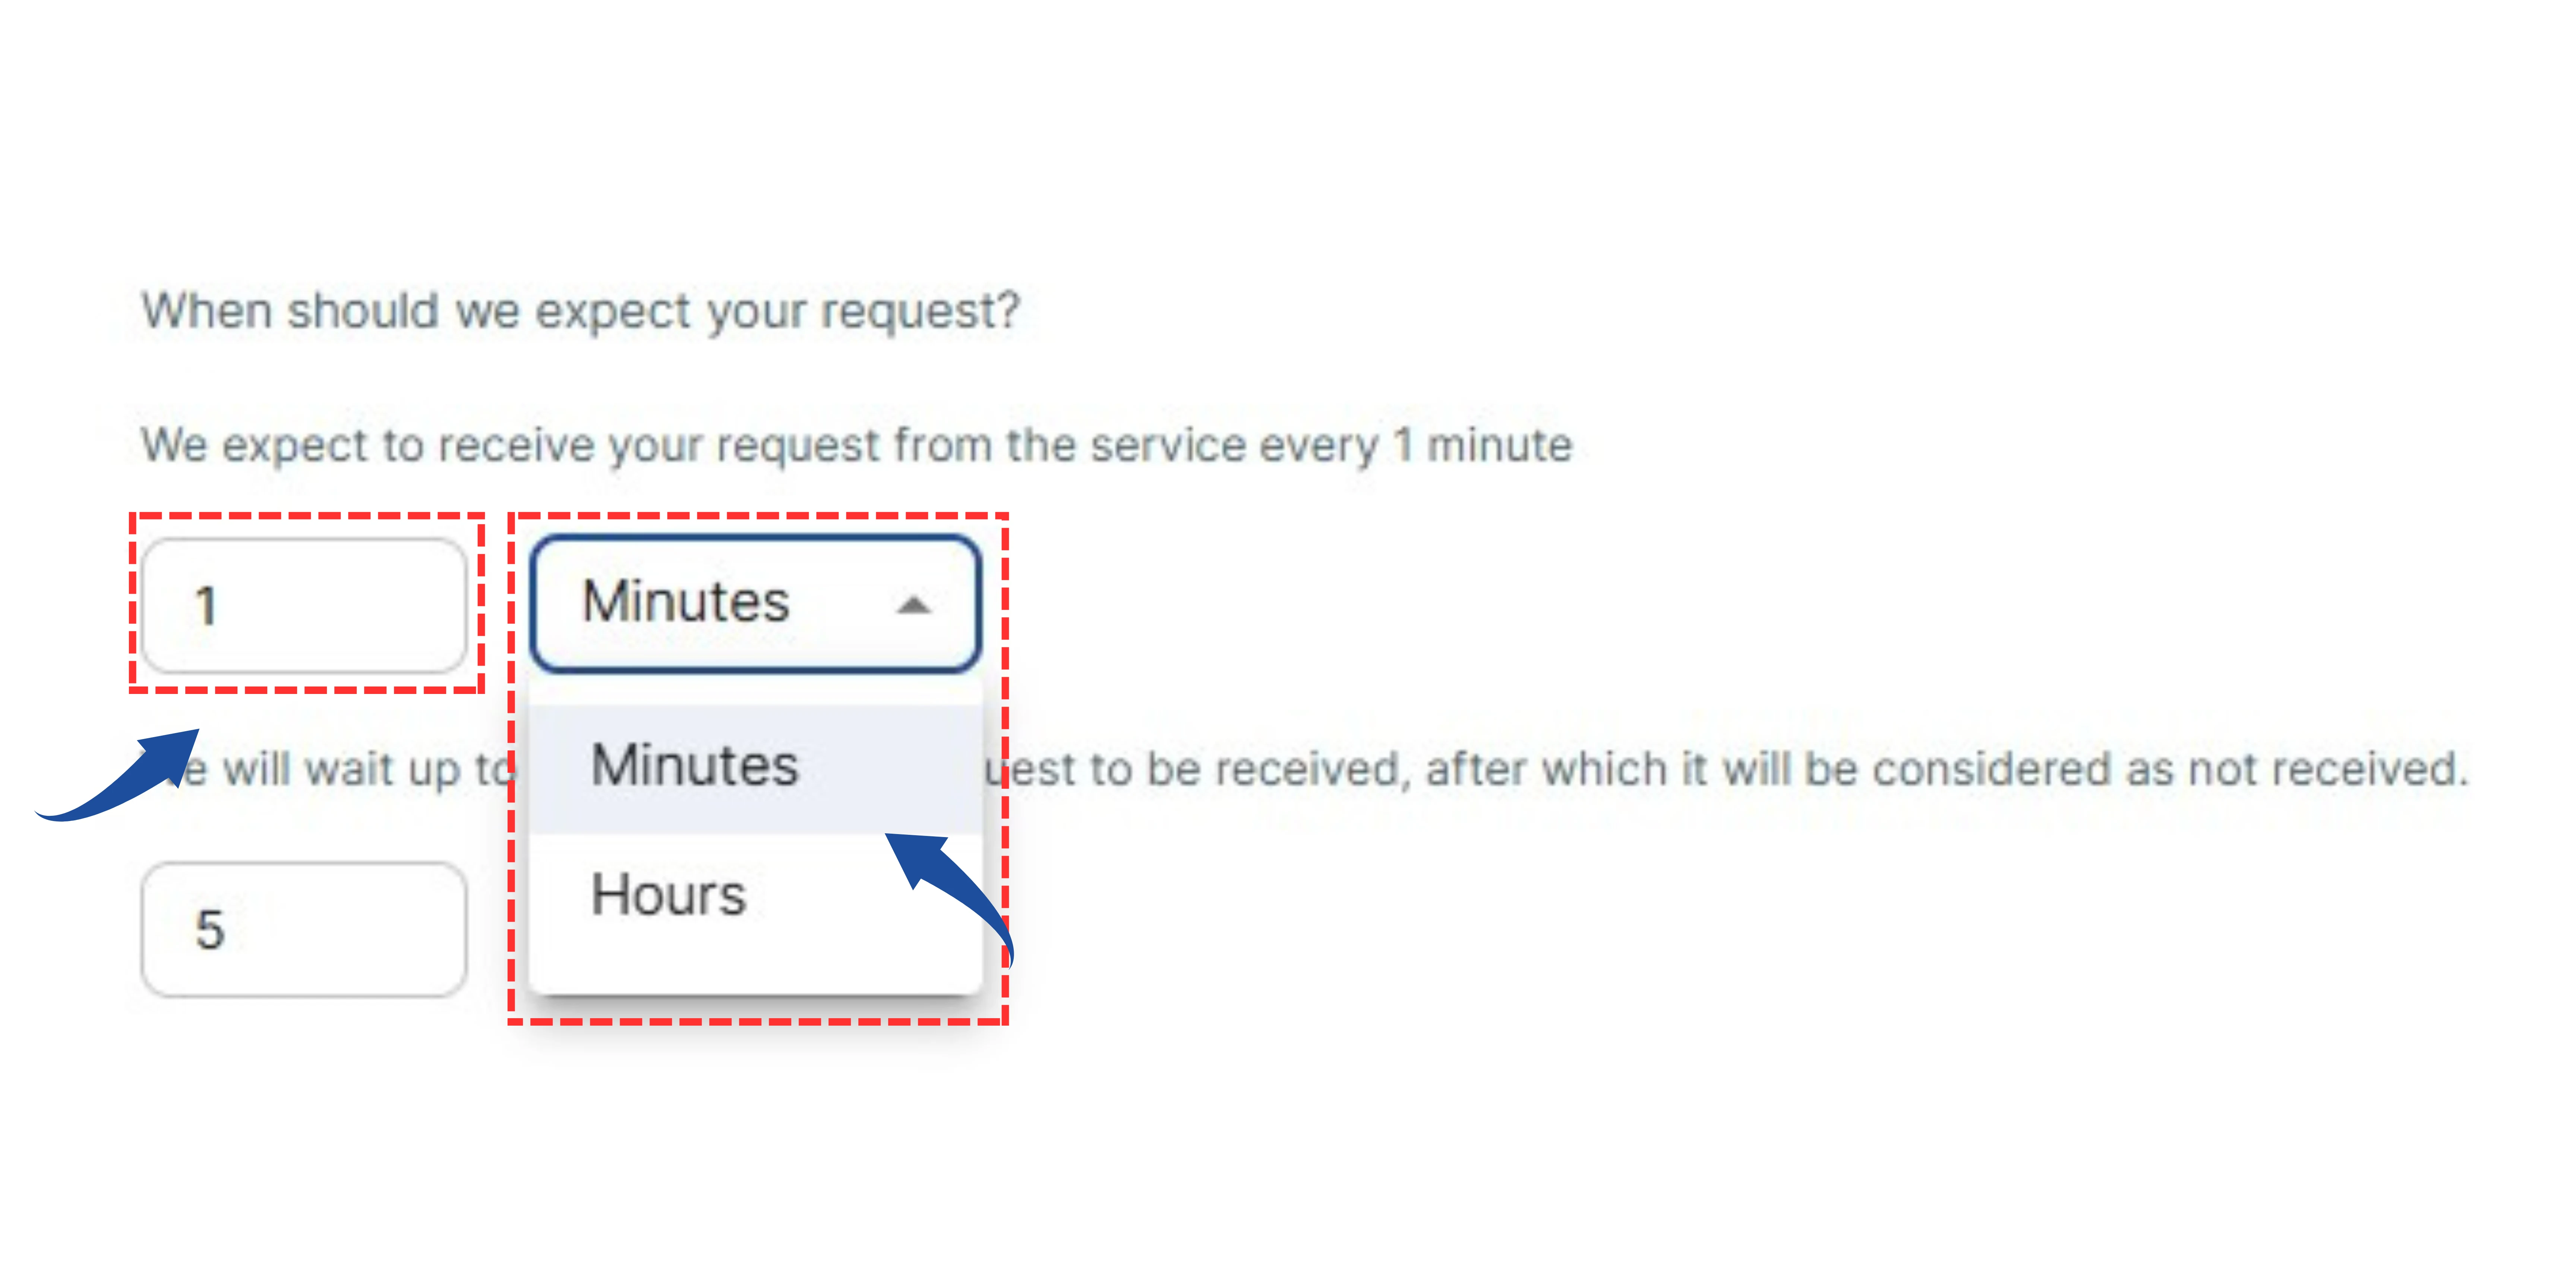
- "We will wait up to...": Set the maximum time the tool will wait for a signal before considering the task as failed (e.g., 5 Minutes).
5 Set Up Alert Notifications
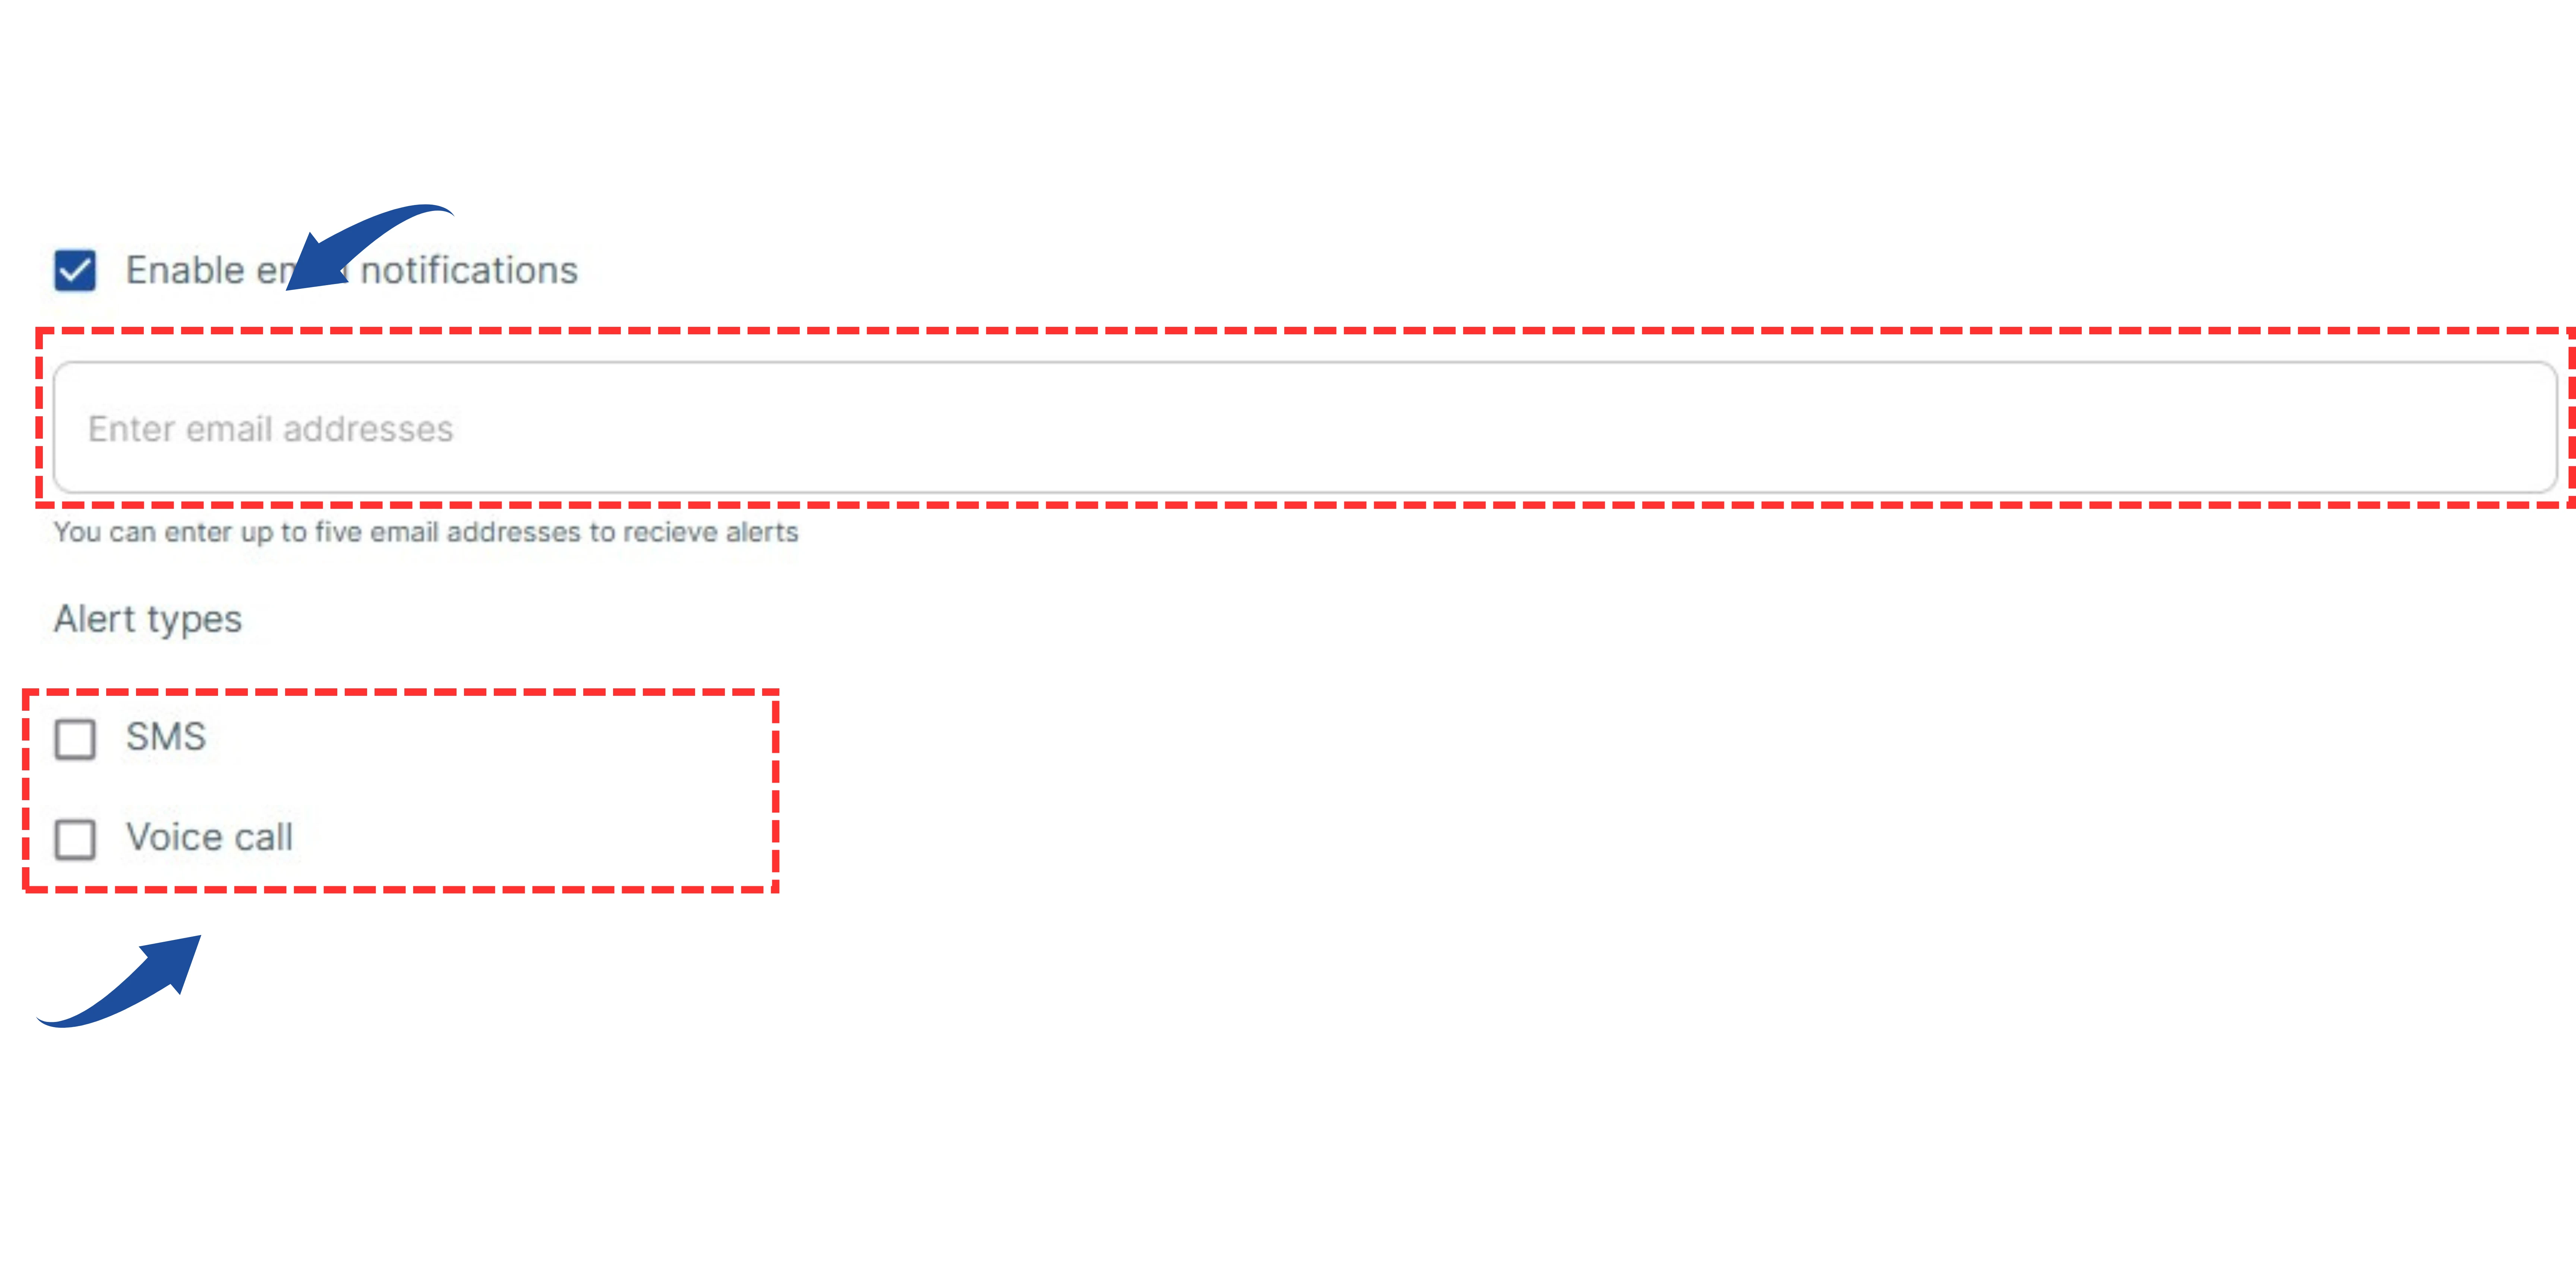
- Email Notifications: Enter the email addresses where you want to receive alert notifications.
- Note: If you don't add any email addresses here, alerts will be sent to the default email on your account (e.g., xyz@gmail.com).
Alert Types: Choose how you want to receive alerts:
- ✅ SMS
- ✅ Voice Call
6 Create The Monitor
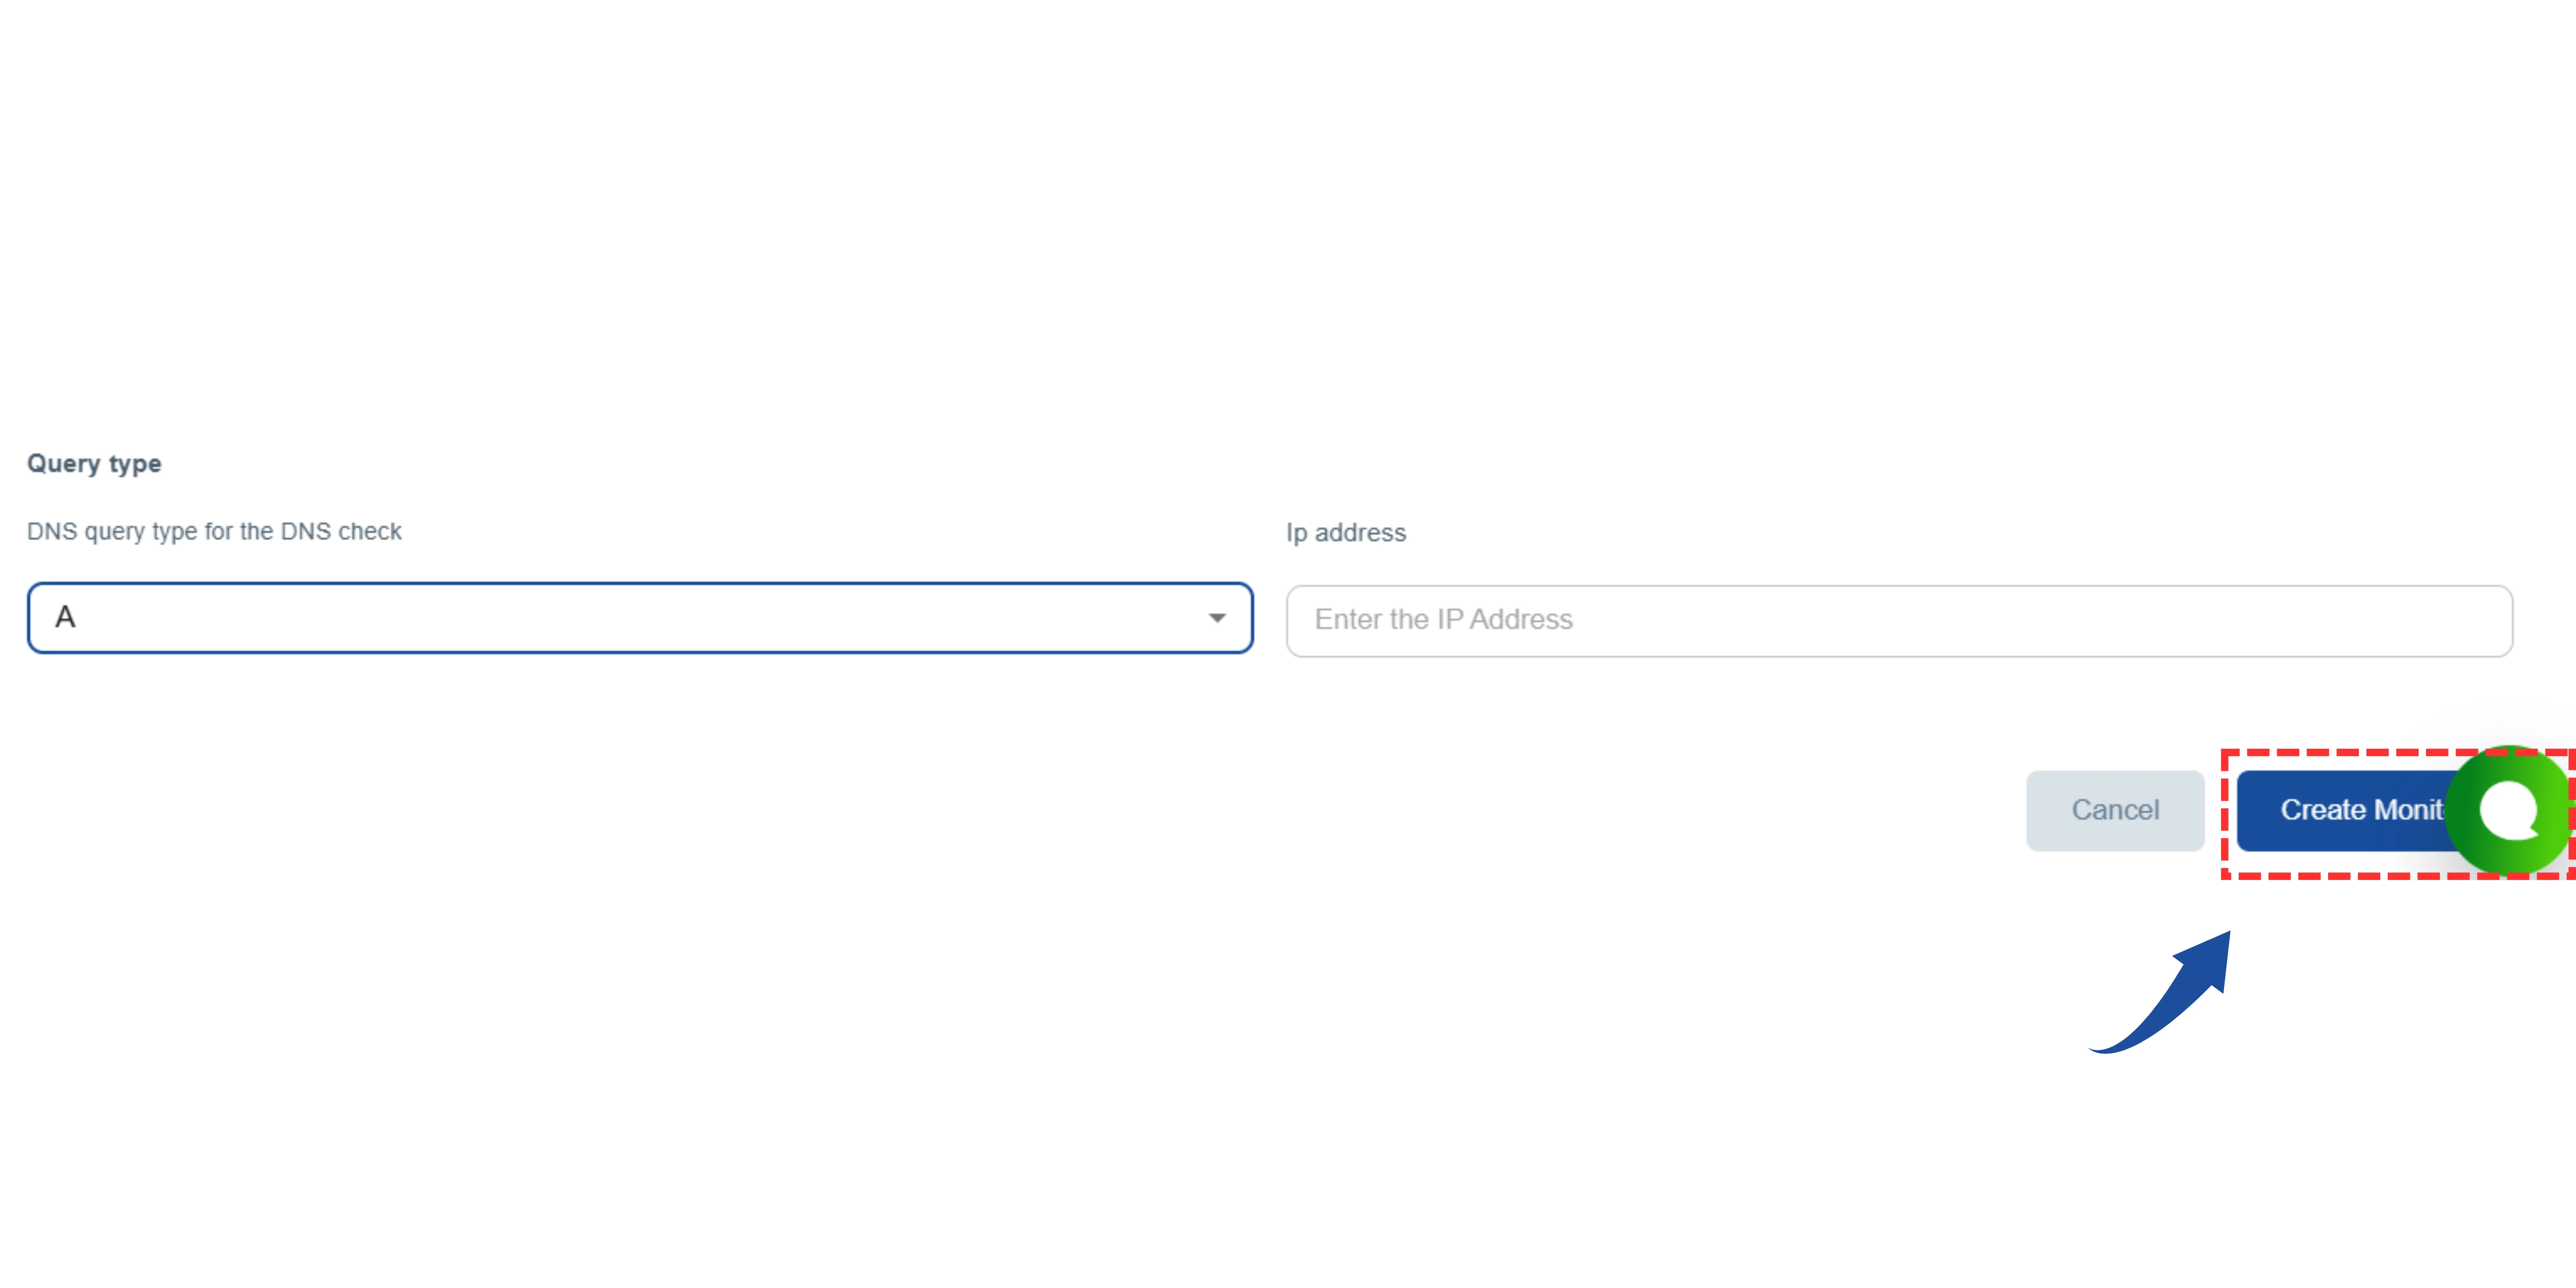
Finally, review all your settings.
Click the "Create Monitor" (or "Next") button to save your configuration and start the monitoring process.